Hi, I am stuck with an assignment question:
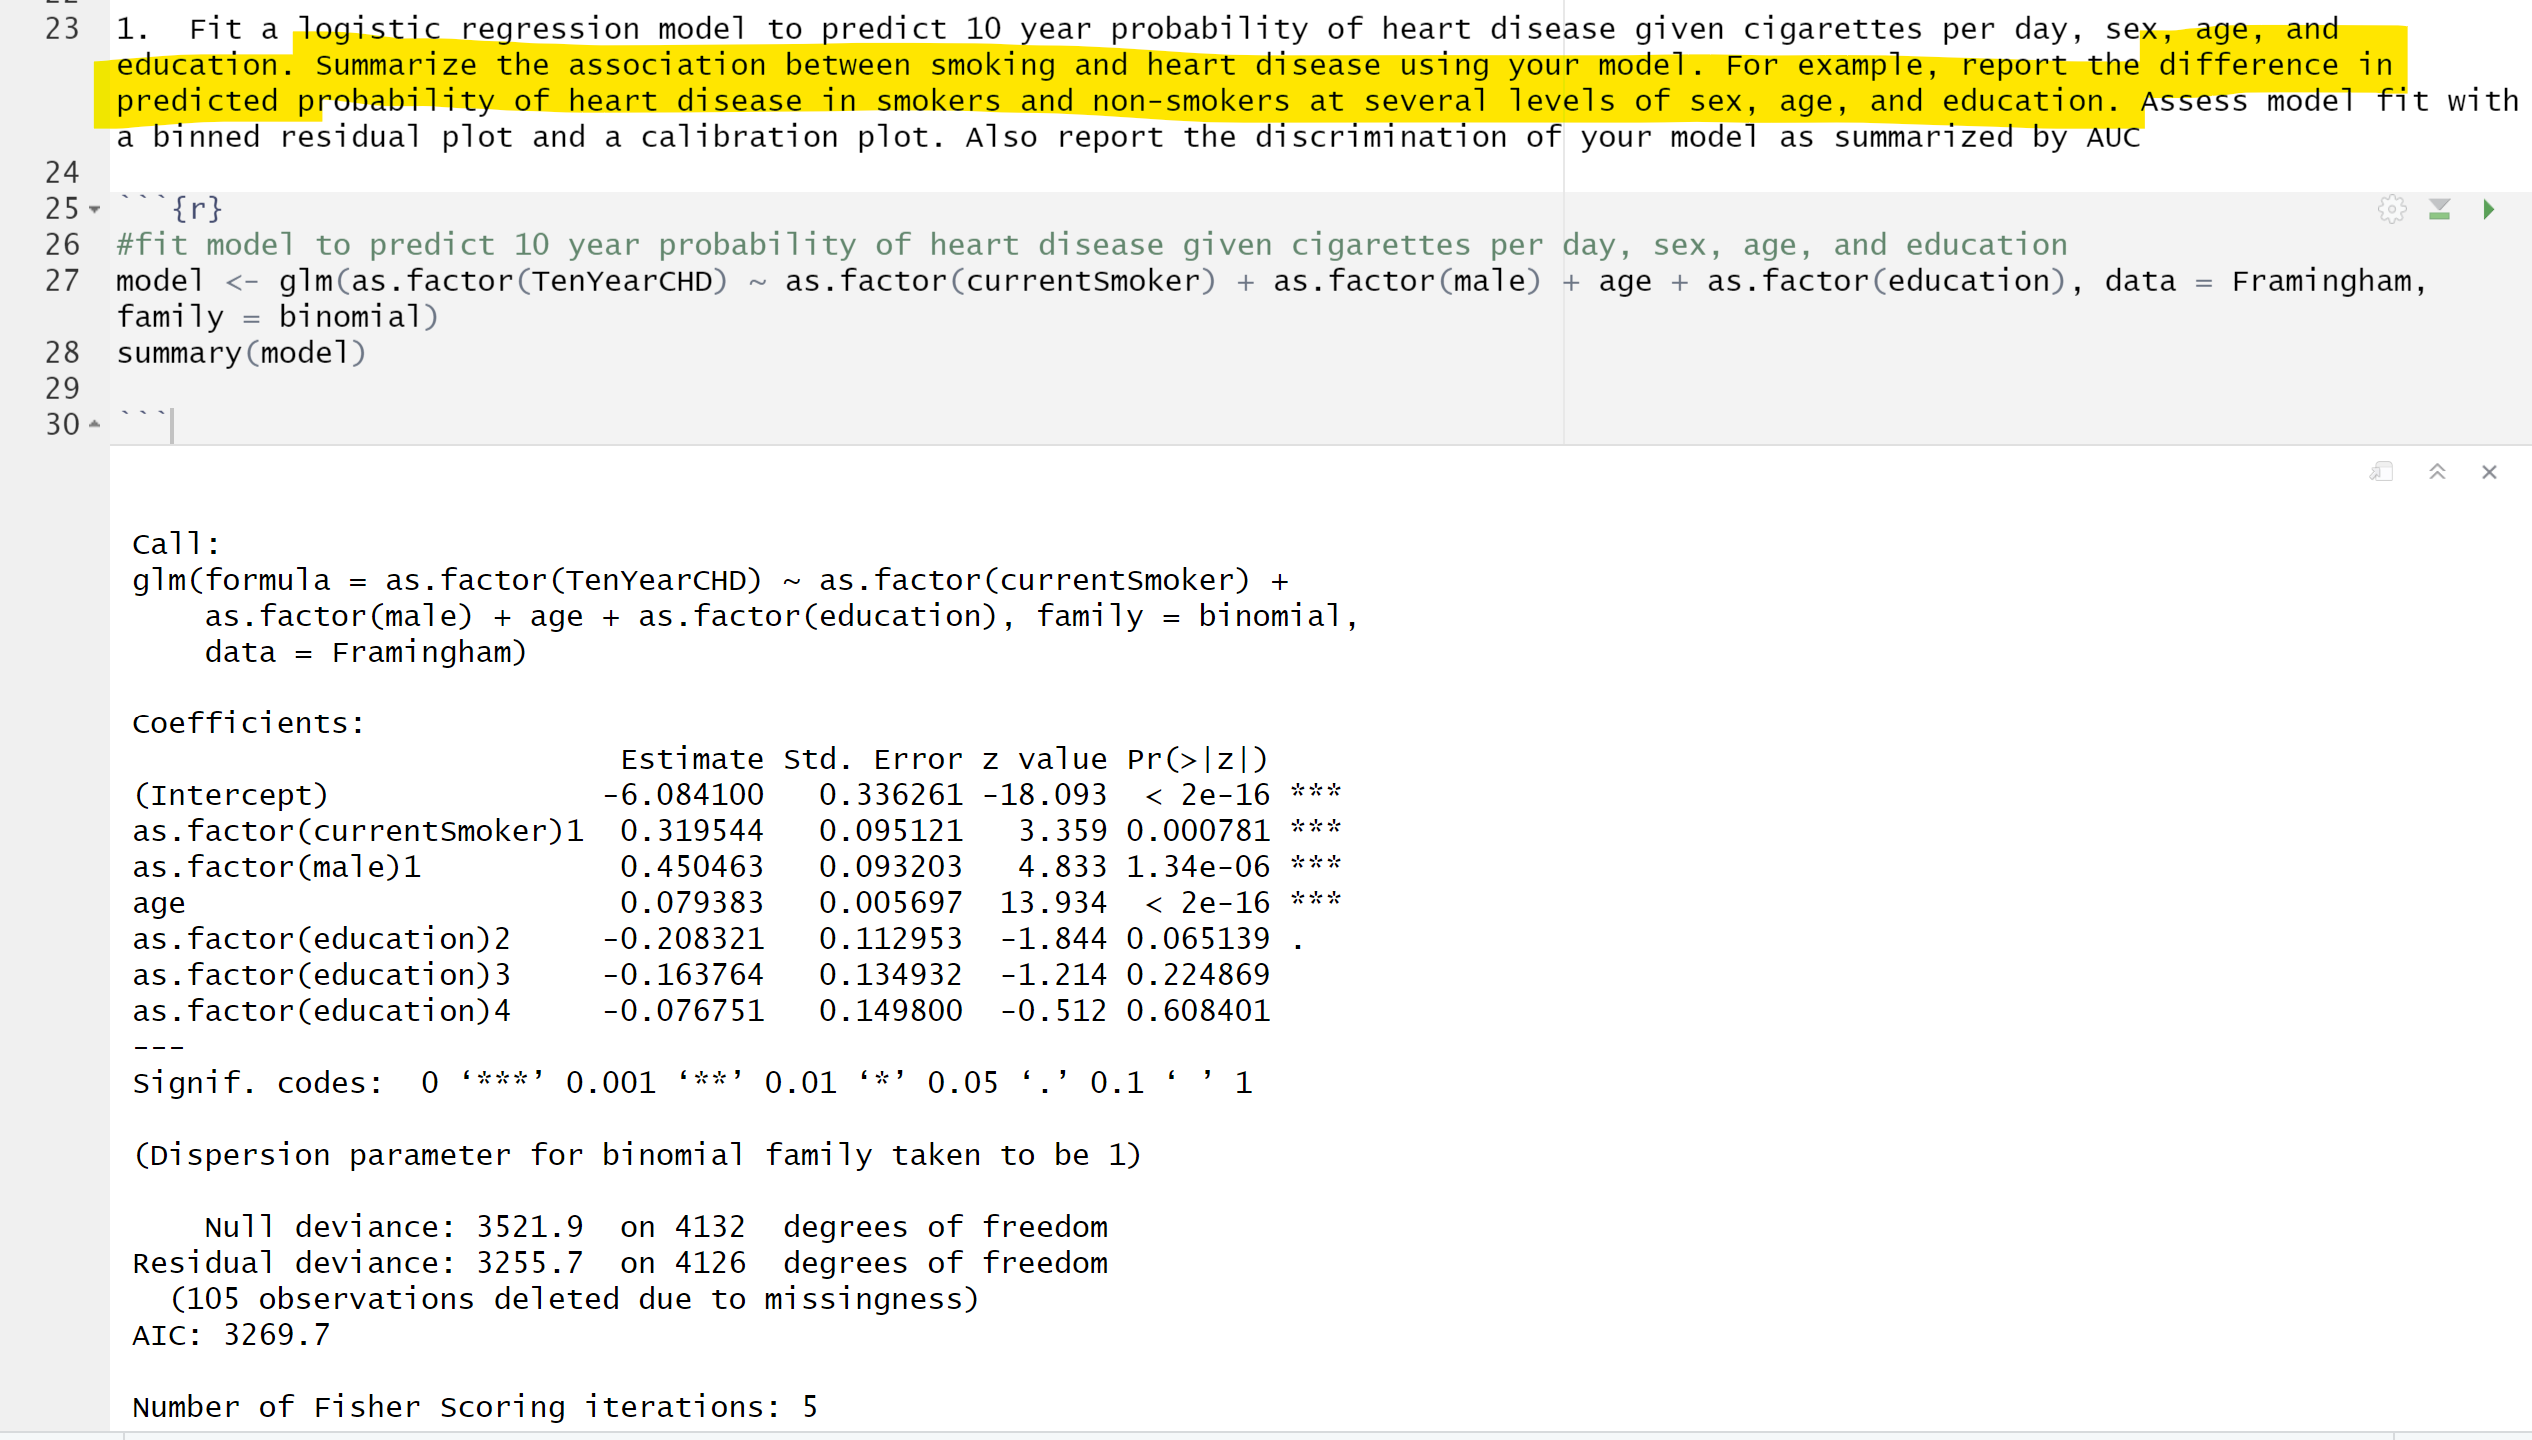
Fit a logistic regression model to predict 10 year probability of heart disease given cigarettes per day, sex, age, and education. Summarize the association between smoking and heart disease using your model. For example, report the difference in predicted probability of heart disease in smokers and non-smokers at several levels of sex, age, and education. Assess model fit with a binned residual plot and a calibration plot. Also report the discrimination of your model as summarized by AUC
I fit a model using the following code:
#fit model to predict 10 year probability of heart disease given cigarettes per day, sex, age, and education
model <- glm(as.factor(TenYearCHD) ~ as.factor(currentSmoker) + as.factor(male) + age + as.factor(education), data = Framingham, family = binomial)
summary(model)
and the output was shown in the snapshot
Can someone help me understand what summary is asking for and how to run binned residual plot and calibration plot?
Thank you