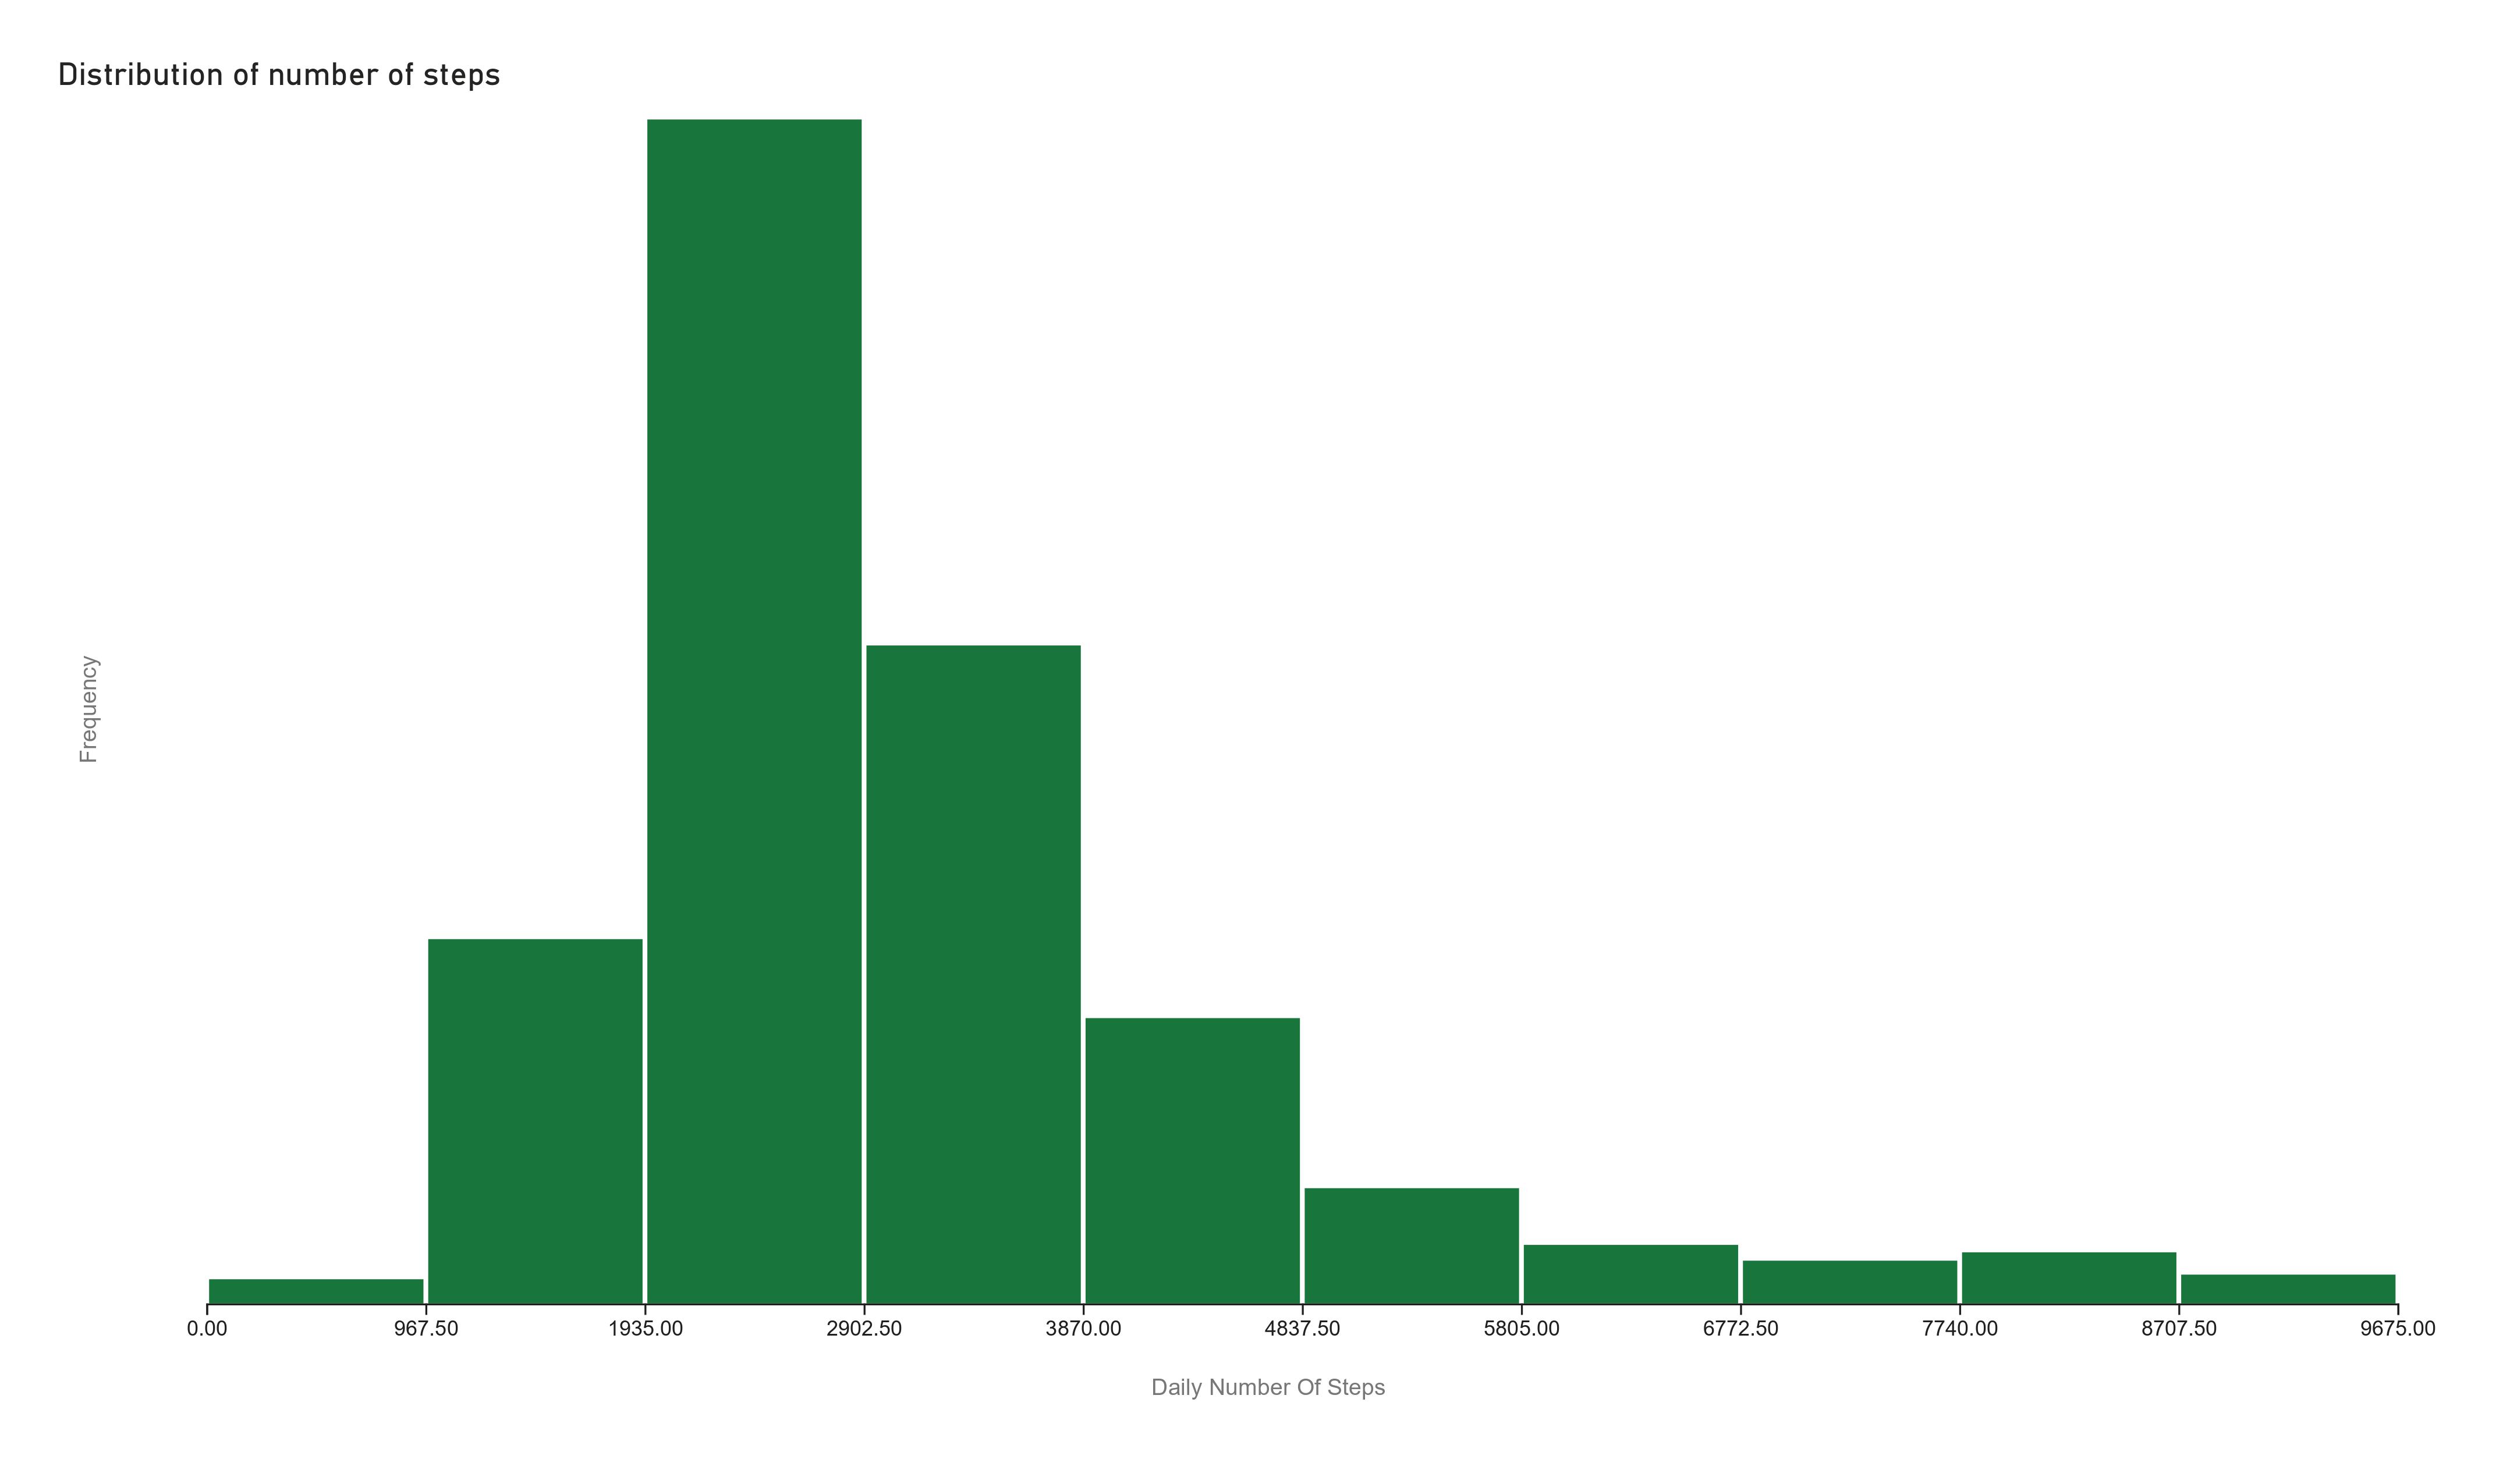
I am running into trouble. I did an association model, but now that i look to one of the independent variables (meandailylegactivitystepsperday) more closely, i can definitely see a (moderate?) positive skew.. I am trying to transform that using log() in the model, the same way i did do this for a positively skewed dependent variable (ketosis).
I've read online that independent variables do not need to have a normal distribution for a linear model. However, another study excecuted by my teacher using partly the same dataset and using this same meandailylegactivitystepsperday did also notice the positively skewed data and did logtransform this in the models.
So i feel that i'll have to do this too but i can't seem to work it out (double () or just single () gave different errors)
You are correct that there is no statistical reason to transform the independent variable. Of course, either linear or log might be a better functional form. For that matter, if you have enough data you can try including both.
You can run two separate regressions, but decide in advance how you will decide which one is better. (If you do this, be sure that the two regressions run on identical observations.) But I was actually suggested including both the lines and log term as independent variables in one regression and seeing if it's obvious which one "works."
As a guess, does steps sometimes equal zero? That would be a problem for taking logs of course.
Whoaaa you're amazing! Yes 'steps' contains 5 zeros! That it should't have obviously but allright! Thanks so much i am gonna try to delete the 0 rows and then see what happens!
Exciteeeed this might work!
These are a lot of exclamation marks but you'll hopefully notice my gratitude.
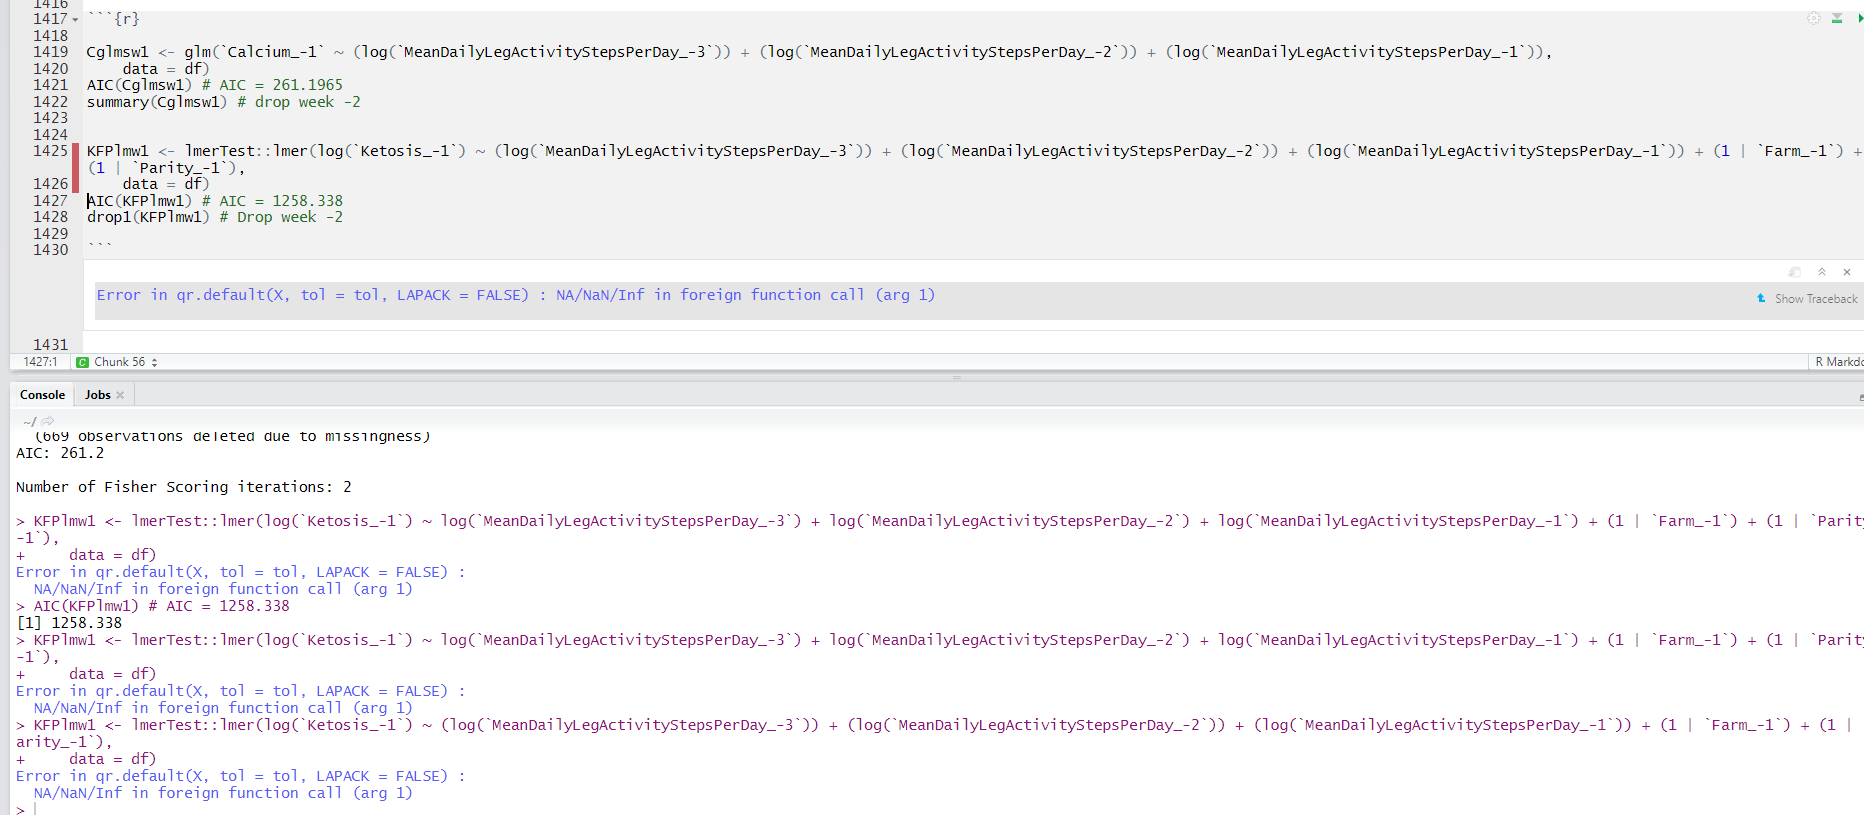
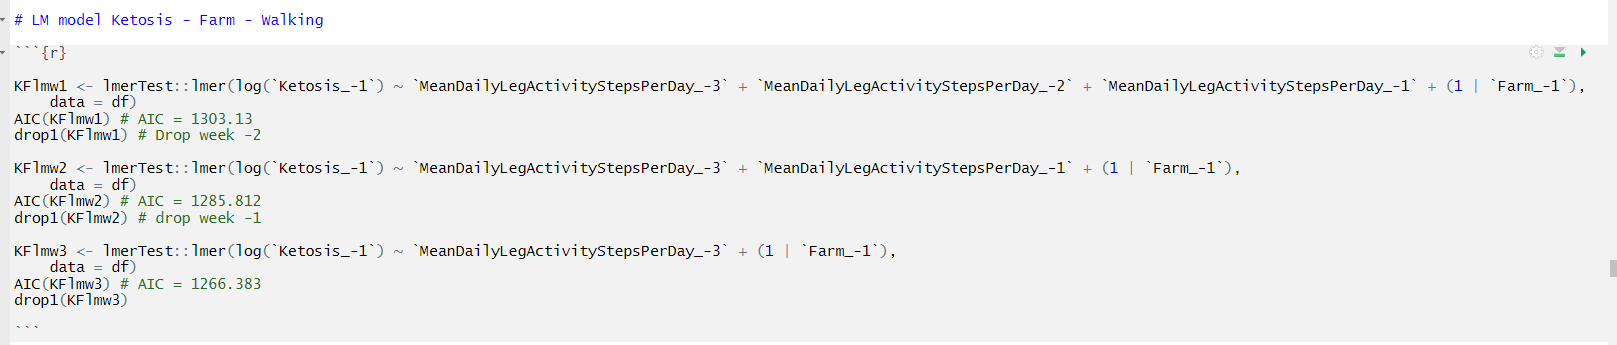
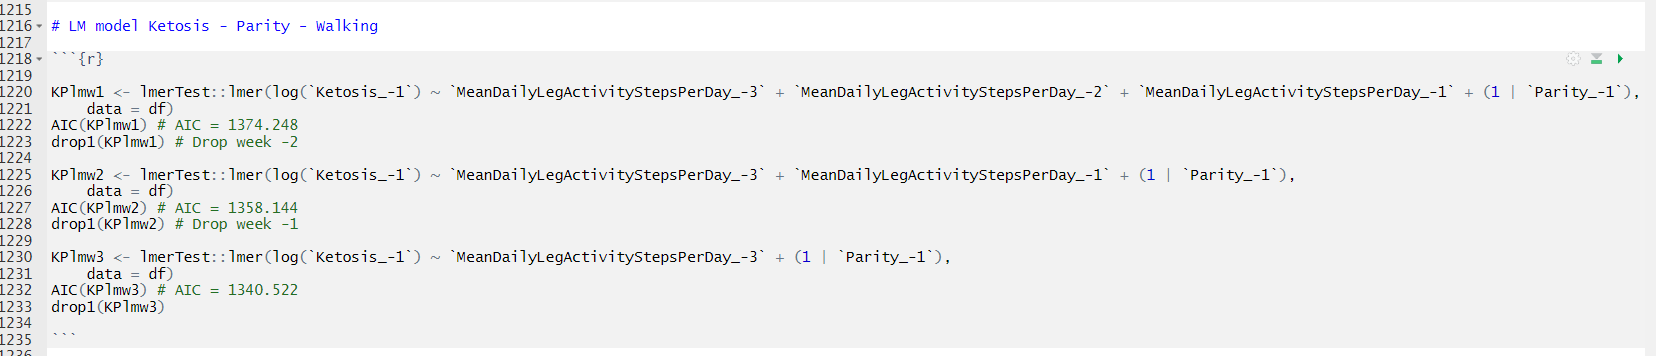
As for the other part, i don't know how to put two the same independent variables in the model and then see which one works. However, i was thinking of making two models for log(ketosis) and steps. One being log(ketosis) ~ steps (-3, -2 and -1), and the other being log(ketosis) ~ log(steps) (-3 -2 and -1). And then using AIC to check which one is better?
Does that make as much sense as i think it does or is this the misinterpretation of someone who is educated for figuring out what is wrong with animals instead of data?
Then: if i can use the AIC scores, can i just do one comparison (one with log(steps) and one with normal steps) and say: hey, AIC score for (for example) normal steps is lower than the model with log(steps), so based on this i can say, for all the models (i have different ones with different random factors and different outcome variables) i can use normal steps? (if it wasn't obvious by now, english is not my native language and i am struggling to explain myself properly).
Using the AIC is perfectly reasonable. But remember that if you eliminate observations with steps==0 from the log equation you have to eliminate them from the linear version as well before making the comparison.
I eliminated the 0 values in the original csv dataset in excel just now! The safest way for me hehe. And i re-uploaded the dataset and am running all the 'steps' models again. So both the log and linear function don't have any zeros anymore.
I guess the biggest question left for me is, do i need to separately run all the models containing 'steps' again with log(steps), or can just one (two?) comparison model suffice? Or maybe two as i am making association models for either behaviour - calcium (with or without random factors farm, parity and farm&parity) and behaviour - ketosis (same random factors configuration) .
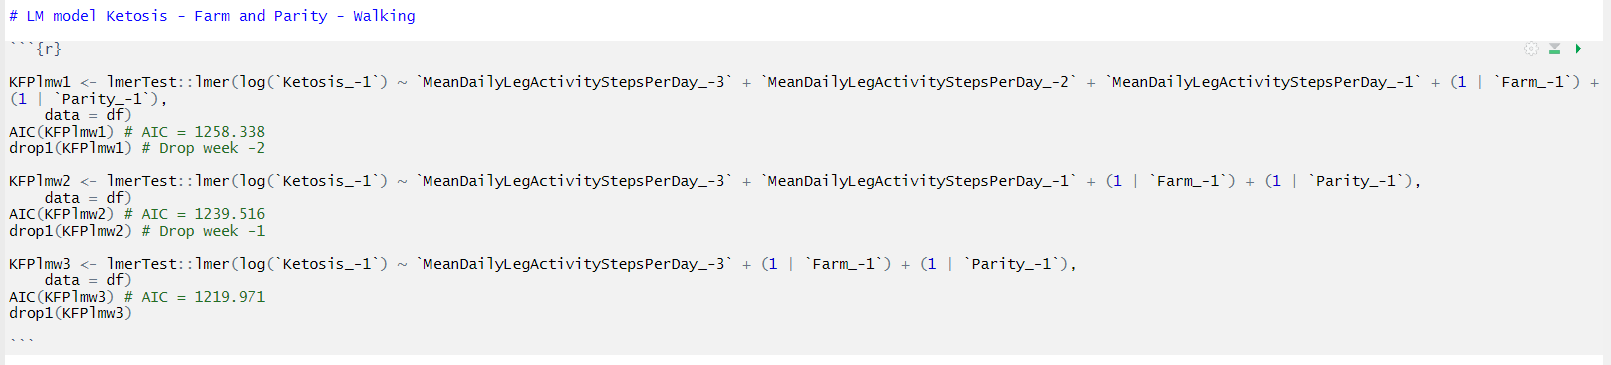
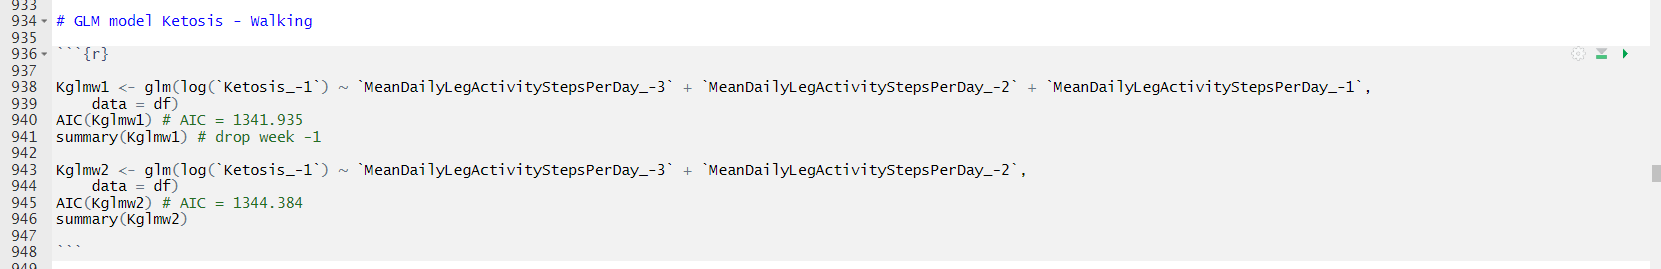
I've attached the screenshots below to better explain (visualization is key, isn't it?) the issue. I can imagine there being a far more efficient way to run the different models as this was just repeated work every time (and then the same but for calcium instead of ketosis, and then the same but for eating, ruminating, lying and walking instead of walking... go figure the time haha). But i am already very fond that all of these are actually running without errors and that i understand them.
There isn't a clear statistical answer. Since you know about animals, you might use your judgement as to whether the effects of the independent variables are likely to be similar for different outcomes!
That will do! Thanks a lot startz, you've been of great help.
I am going to think long and hard and then i think i will judge that as there are no statistical reasons to transform the independent variable, i will keep it this way ;).