Good morning,
I have this model, I have done some trials before, but trying with the simplest models, my residuals are always wrong, it doesn't matter how many predictors and random effects, I add them or not the result of the residuals is always wrong, I don't know what to do. Please can you help me?. I tried a lot of things (lmer, glmer, brms). Thank you so much!!!
lmer
modelo <- lmer(
Distancia ~ Enfermo + (1 | Nombre),
data = DATA
)
residuals <- resid(modelo)
fitted_values <- fitted(modelo)
plot(fitted_values, residuals, pch=3, col="green",
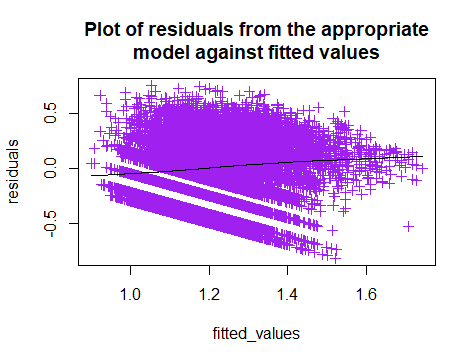
main="Plot of residuals from the appropriate\nmodel against fitted values")
lines(lowess(residuals~fitted_values))
Hi, apologies for the wrong explanation.
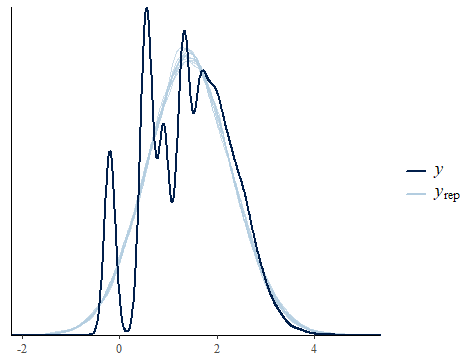
What I mean is? That wherever I do my model doesn't not fit properly when I do a residual plot. I've always obtained patterns, and heteroscedasticity. And the plot should be homogeneous. The same happened with my brms models, when I finished my models I try pp-check() and doesn't fit either.
I hope these answers your questions
Cheers and thank you so much
Hi, thank you so much for your answer.
In my case is for the next reason. Heteroscedasticity can cause issues because it violates one of the assumptions of ordinary least squares.
Please, find attached an image
As you can see in the image the pattern are very weird.
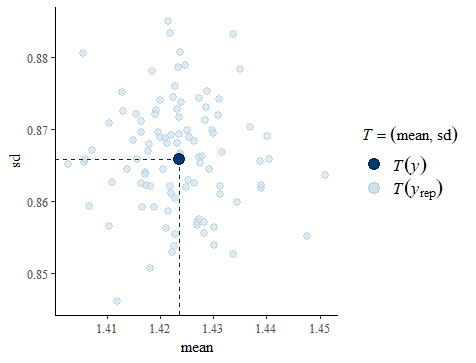
And in my brms model the plot doesn't fit enough but yes the residuals (see below)
In both model, the result is the opposite, I don't know what to do
Thanks again,
Cheers
Yes, heteroskedasticity violates an assumption of ordinary least squares. However, it basically only screws up the standard errors. Least squares coefficients are still unbiased.
If heteroskedasticity is present in in the error terms, least squares will not eliminate it. So its presence does not indicate an error.
I am more concerned about your plot of residuals against fitted values. Is the black line a regression line? It looks like the fitted values and residuals are correlated. That's impossible in ordinary least squares. So correlation would indicate a coding error.
Hi, again, thanks for your answer.
Yes, the line is a regression line. This is used to add a lowess regression line to the plot. I tried the code in many version. Even I tried to choose few rows in my data frame but the result is always the same. Please, can you help with this?
this kind of pattern on residual vs fitted is often caused by a discrete distribution of the response (eg, the bottom two purple stripes are for response values 0 and 1 (or maybe 0 and 1 in the stripe at the bottom, and 2 in the stripe above it).
Hint for the original poster: if you're asking for help, saying that something is "wrong" is not helpful to anyone intending to answer your question. Say what you expected, and say how your result differs from that. Then, your reader has a place to start from in answering your question.