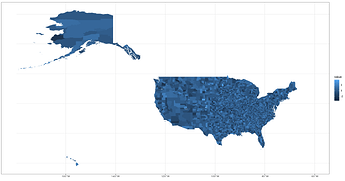
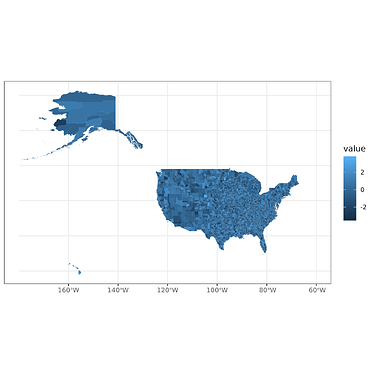
I am plotting a shape file and I was trying to reduce width/remove my borders using the linewidth option. My map looks good when I look at in the viewer in R Studio. However, once I save my plot the border lines return.
My data is a multi-polygon shp file of US counties with a numeric value for each county. (For this test I literally just ran rnorm). (The site wouldn't let me upload a shp file to the post but if someone know any easy way to share my data I happy to share the shape file I used)
I ran this code to generate the plot:
test.USA = ggplot(data = USA_sf) +
  geom_sf(aes(fill = value), linewidth = 0) +
  theme_bw() +
  coord_sf(xlim = c(-180, -60))
When I look at the plot in R Studio this is what I see:
However once I save it the borders return. I tried both a pdf and png and both cases the borders are present. Though the borders do look slightly different depending on the device.
PDF:
testing_border_width.pdf (511.5 KB)
PNG:
I am not sure I understand how line width is interacting with the device but if anyone has any ideas on how to make this more consistent please let me know. I would especially like to get this to work in the pdf since that is our preferred file type.

