EmilyA
December 5, 2019, 7:16pm
1
When I publish my Shiny App, lines appear on my bar graphs that aren't there when I just run my Shiny App. I do not specify the size of my plots in my code (I just call the name of the graph).
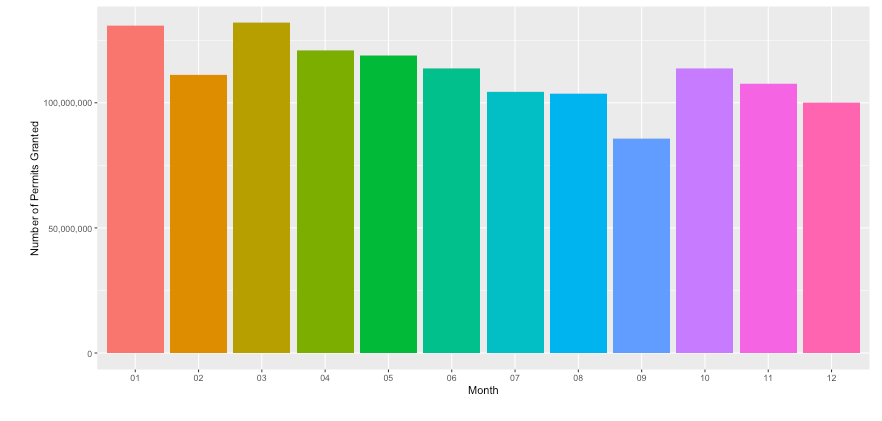
This is what my graph looks like when I run my Shiny:
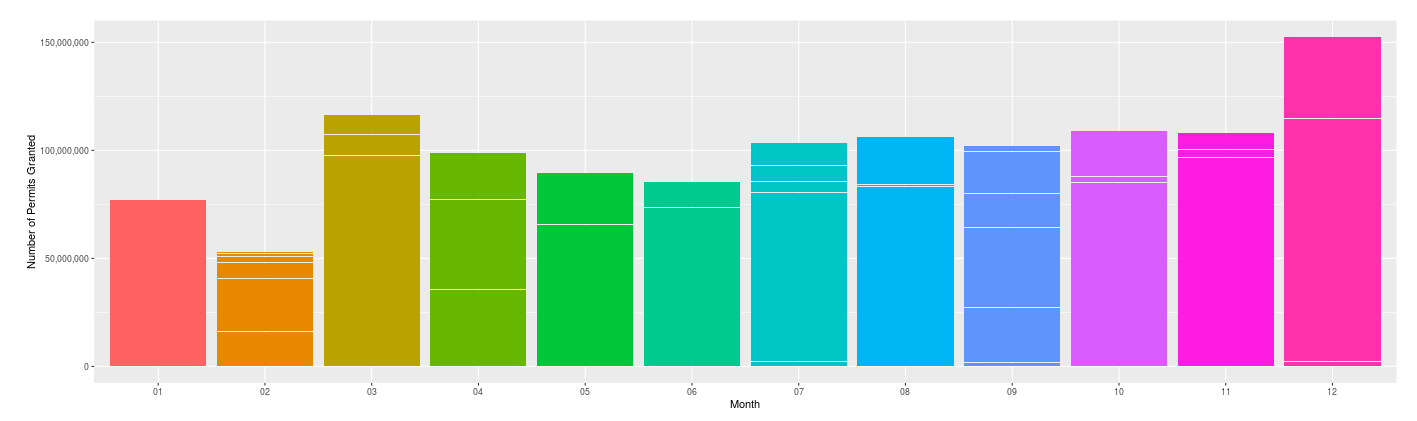
This is what my graph looked like when I publish my Shiny App:
Any ideas on how to resolve this issue? Thank you.
raytong
December 5, 2019, 11:42pm
2
Hi @EmilyA . Try to map the color as the fill in ggplot. If problem still there, can you share your code?
1 Like
EmilyA
December 6, 2019, 5:19am
3
Thank you for your response. My color is set by the fill in ggplot.
Here's my code:
output$permit <- renderPlot({
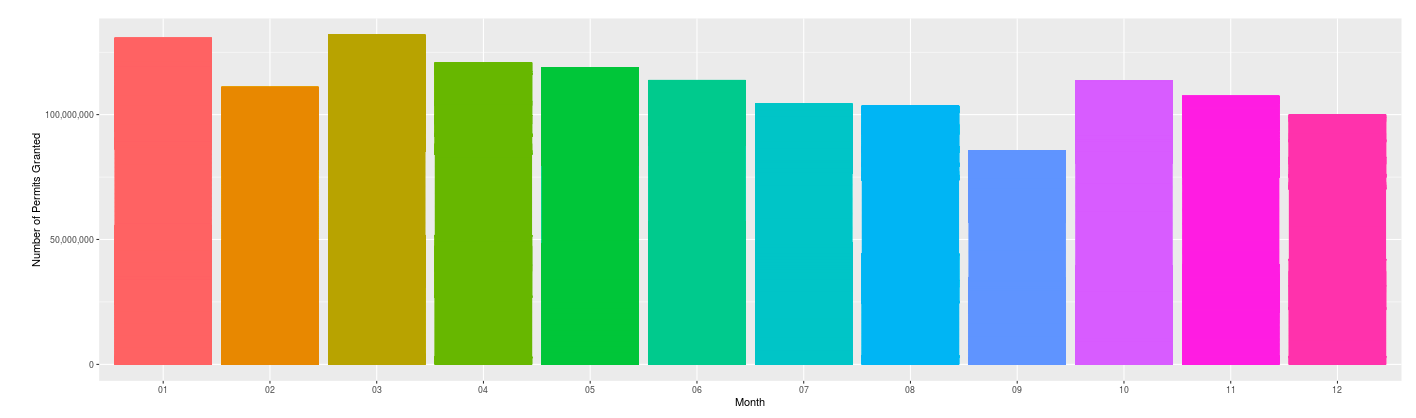
@EmilyA . You may try to set the color also as follow.
output$permit <- renderPlot({
final_data %>%
filter(year == input$chosenyear) %>%
ggplot(aes(x = month, y = permit, fill = month, color = month)) +
geom_bar(stat = 'identity', show.legend = FALSE) +
labs(x = "Month",
y = "Number of Permits Granted") +
scale_y_continuous(labels = comma)
})```
1 Like
EmilyA
December 6, 2019, 7:55pm
5
It worked!!! Thank you so much!!!
system
December 13, 2019, 7:55pm
6
This topic was automatically closed 7 days after the last reply. New replies are no longer allowed.