Here is a self contained example that you should be able to copy/paste into your system and run. After you confirm it works, look at the File1 and File2 objects and see how they differ from the files you are working with.
library(dplyr)
library(ggplot2)
File1 <- structure(list(dur = c(35L, 35L, 35L, 59L, 59L, 59L, 51L, 51L,
51L, 43L, 43L, 43L),
energy = c(102L, 102L, 102L, 102L, 102L,
102L, 100L, 100L, 100L, 100L, 100L, 100L),
f01 = c(235L, 234L, 235L, 238L, 239L, 238L, 240L,
239L, 238L, 245L, 250L, 255L),
values = c(633L, 914L, 1194L, 3322L, 3791L, 4260L, 6525L,
6932L, 7339L, 9030L, 9372L, 9713L),
val = c(2L, 3L, 4L, 11L,12L, 14L, 22L, 23L, 24L,
30L, 31L, 32L),
File = c(1L, 1L,1L, 1L, 1L, 1L, 1L, 1L, 1L, 1L, 1L, 1L)),
class = "data.frame", row.names = c(NA, -12L))
File2 <- structure(list(dur = c(35L, 35L, 35L, 59L, 59L, 59L, 51L, 51L,
51L, 43L, 43L, 43L),
energy = c(102L, 102L, 102L, 102L, 102L,
102L, 100L, 100L, 100L, 100L, 100L, 100L),
f01 = c(245L, 244L, 245L, 248L, 249L, 248L, 250L, 249L,
248L, 255L, 260L, 275L),
values = c(633L, 914L, 1194L, 3322L, 3791L, 4260L, 6525L,
6932L, 7339L, 9030L, 9372L, 9713L),
val = c(2L, 3L, 4L, 11L, 12L, 14L, 22L, 23L, 24L, 30L, 31L, 32L),
File = c(2L, 2L,2L, 2L, 2L, 2L, 2L, 2L, 2L, 2L, 2L, 2L)),
class = "data.frame", row.names = c(NA, -12L))
AllDat <- rbind(File1, File2)
AllDat <- AllDat %>% group_by(File) %>%
mutate(Grp = (row_number() - 1) %/% 3,
File = factor(File))
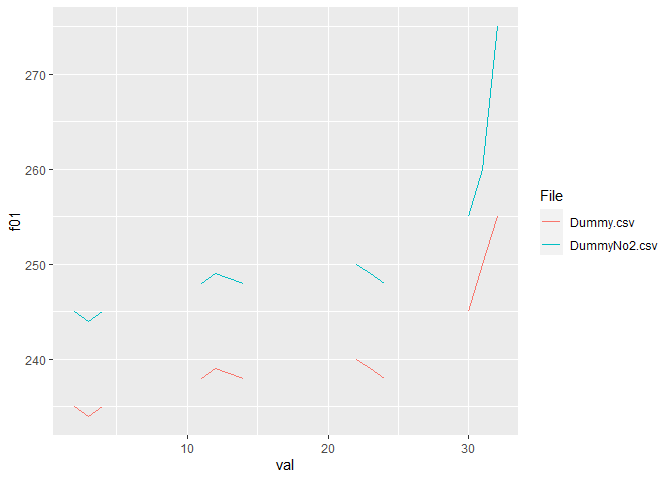
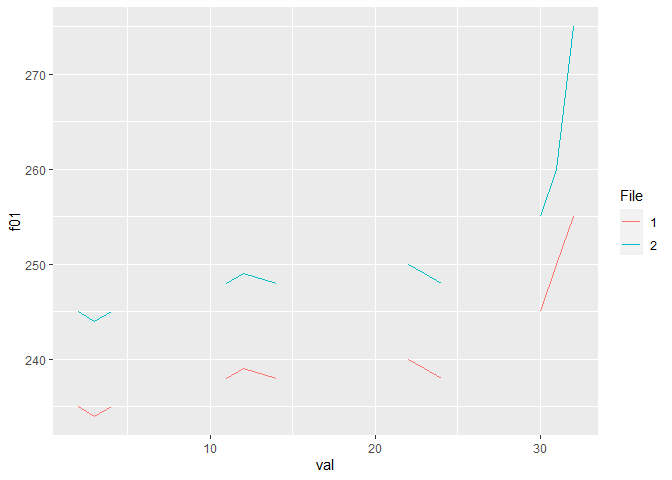
ggplot(AllDat, aes(val,f01, group = interaction(Grp, File), color = File)) + geom_line()
Created on 2021-03-08 by the reprex package (v0.3.0)