Hi Bhima,
and welcome to the R Community!
You need to create a reprex (REProducible EXample) to help us
help you answer your question.
To help you get started, I have taken a guess at
what you might want, and created a simple reprex below.
library(tidyverse)
library(corrr)
data <- data.frame(
patient_id = rep(c(1:5),4),
sbp = c(145, 138, 127, 124, 122,
142, 135, 124, 121, 118,
146, 137, 128, 126, 124,
143, 136, 123, 127, 132),
dbp = c(93, 88, 82, 77, 72,
95, 91, 85, 79, 76,
91, 85, 80, 73, 68,
96, 89, 88, 74, 79),
time = rep(c(1,2,3,4,5),4)
)
print(data)
#> patient_id sbp dbp time
#> 1 1 145 93 1
#> 2 2 138 88 2
#> 3 3 127 82 3
#> 4 4 124 77 4
#> 5 5 122 72 5
#> 6 1 142 95 1
#> 7 2 135 91 2
#> 8 3 124 85 3
#> 9 4 121 79 4
#> 10 5 118 76 5
#> 11 1 146 91 1
#> 12 2 137 85 2
#> 13 3 128 80 3
#> 14 4 126 73 4
#> 15 5 124 68 5
#> 16 1 143 96 1
#> 17 2 136 89 2
#> 18 3 123 88 3
#> 19 4 127 74 4
#> 20 5 132 79 5
corr <- data %>%
correlate() %>%
focus(-patient_id, mirror = TRUE) %>%
rearrange()
#>
#> Correlation method: 'pearson'
#> Missing treated using: 'pairwise.complete.obs'
#> Registered S3 method overwritten by 'seriation':
#> method from
#> reorder.hclust gclus
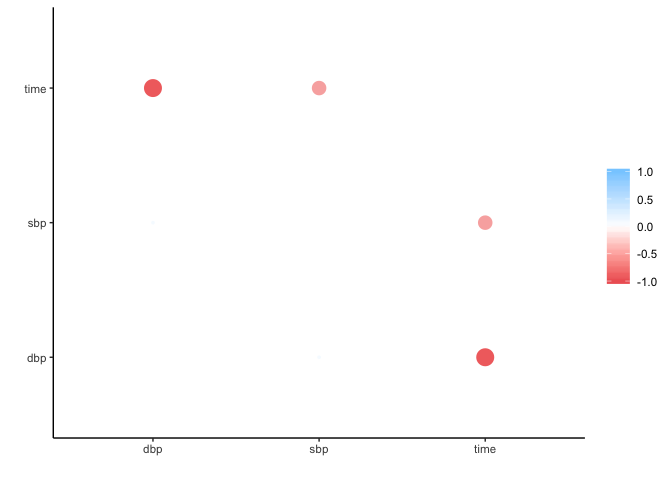
fashion(corr)
#> rowname dbp sbp time
#> 1 dbp .79 -.92
#> 2 sbp .79 -.87
#> 3 time -.92 -.87
rplot(corr)
#> Don't know how to automatically pick scale for object of type noquote. Defaulting to continuous.
Created on 2019-11-03 by the reprex package (v0.3.0)
To learn how to make your own reprex, read here:
https://www.jessemaegan.com/post/so-you-ve-been-asked-to-make-a-reprex/