Levene's Test, T-test and Bar plots

Hello,

I have a dataset which has two variables. One is the measurement of the length (called Sepal.Length) and the other one is Species. Species has two categories (versicolor and setosa labeled as 1 and 2 respectively).

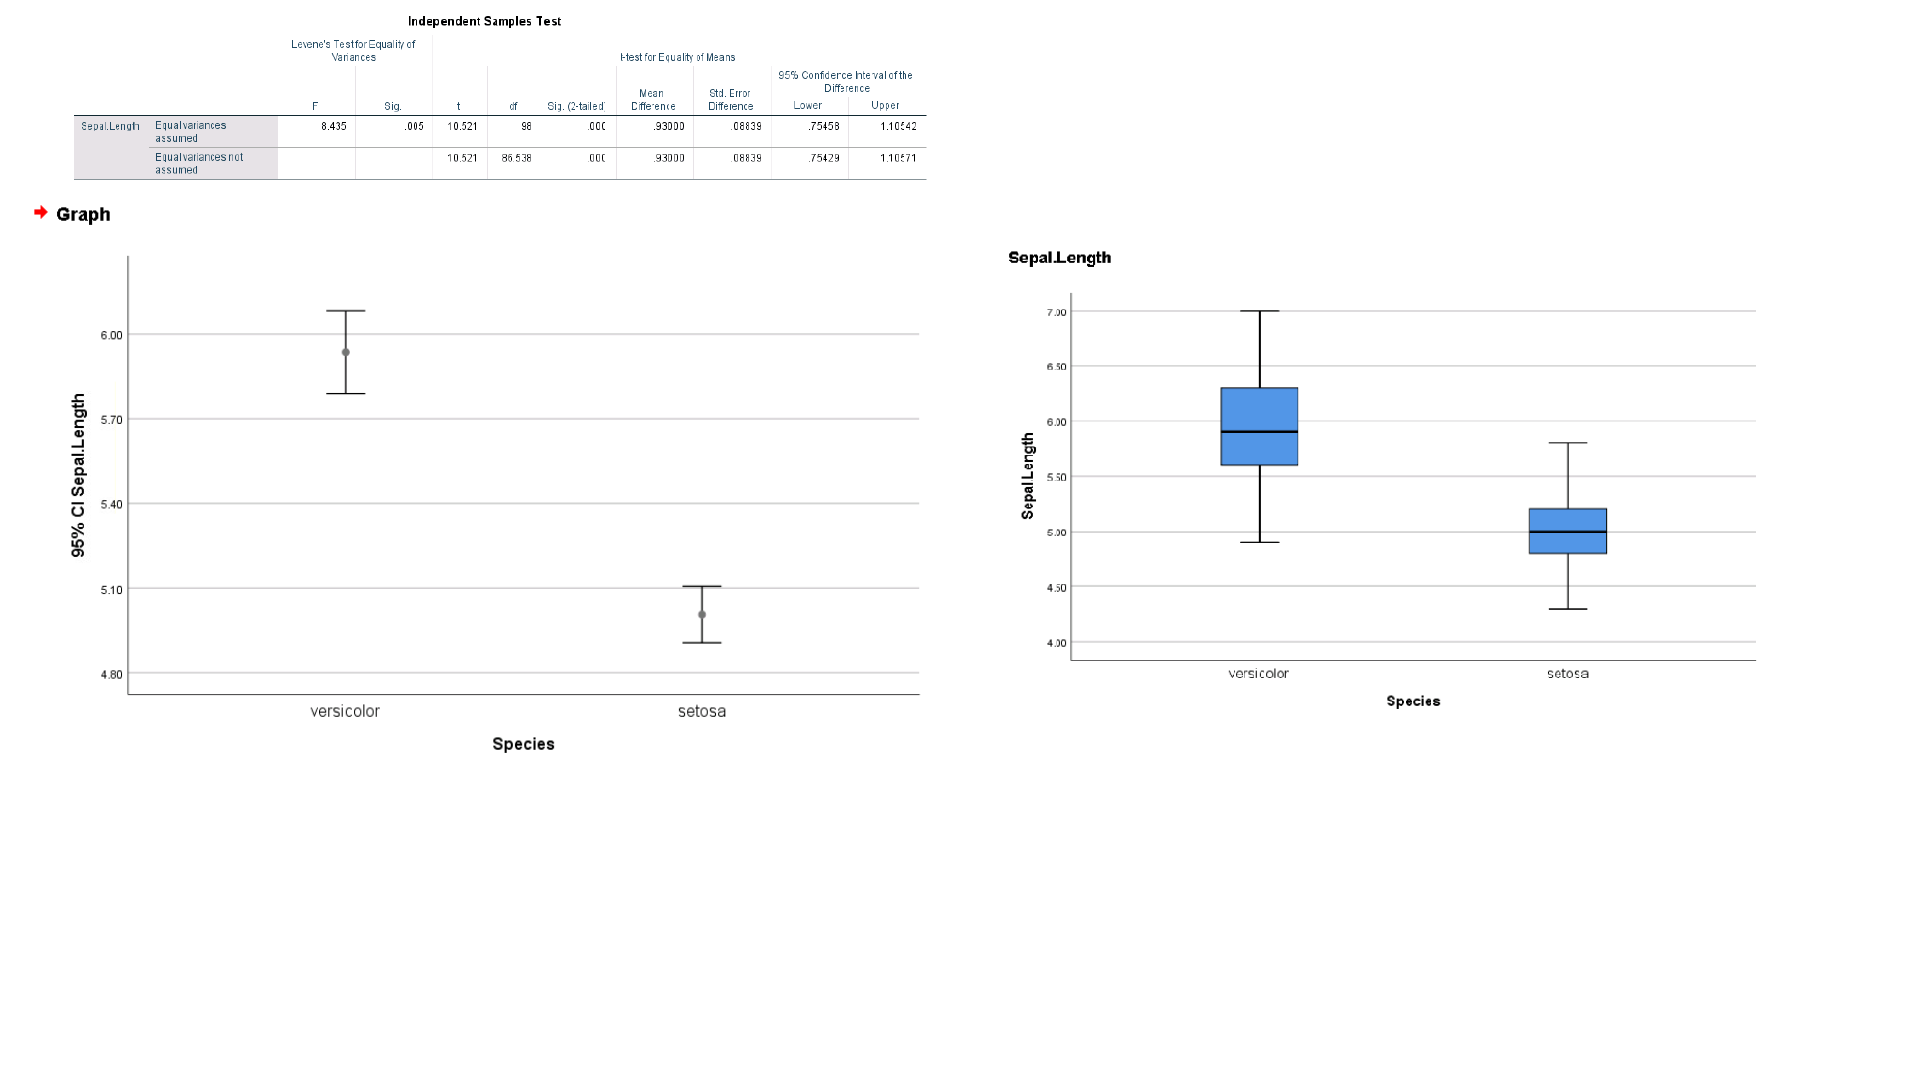
Here first I want to do a Levene's test for equality of variances for the variable Sepal.Length for the two categories of Species. Then I want to conduct a T-test for the equality of mean for Sepal.Length for the 2 categories of Species. The 1st part of the image shows the output that I want to create (These were done in SPSS).

Then I am trying to create a bar plot of mean with 95% confidence interval and a boxplot for Sepal.Length of both the categories. The second part of the image shows these two plots that I want to generate, which were again done on SPSS. I have given a link of my dataset also.

Can anybody please help me with the R codes to do the above stuffs?

Many thanks.

Hello,
You can do that like this:

# load packages
library(readxl)
library(ggplot2)
library(car)

# import the data
iris <- read_excel("Data.xlsx")

# make the species a factor
iris$Species <- factor(iris$Species)

# Levene's test for homogeneity of variance
leveneTest(data = iris, Sepal.Length ~ Species)

# t test not assuming equal variance
t.test(data = iris, Sepal.Length ~ Species)
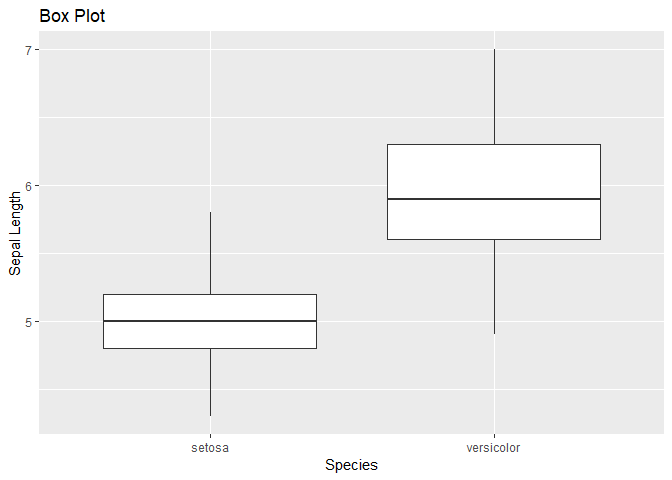
# box plot
ggplot(data = iris, aes(y = Sepal.Length, x = Species)) +
  geom_boxplot()

Winston Chang's Cookbook for R is useful reference for this sort of thing http://www.cookbook-r.com/

Have fun!

1 Like

Thanks for the reply. Actually I tried to do the Levene's test before by using the package "car". However, somehow I can't install the package in R. Whenever, I try to install, it says -

package ‘car’ is not available (for R version 3.4.1)

Can you please help me to solve the issue?

Thanks again.

car package requires R >=3.5 so you have to update R first, this is a good idea anyways because is going to save you a lot of installation troubles, latest R version is 3.6

Thank you very much @emma. I reinstalled R and things worked.

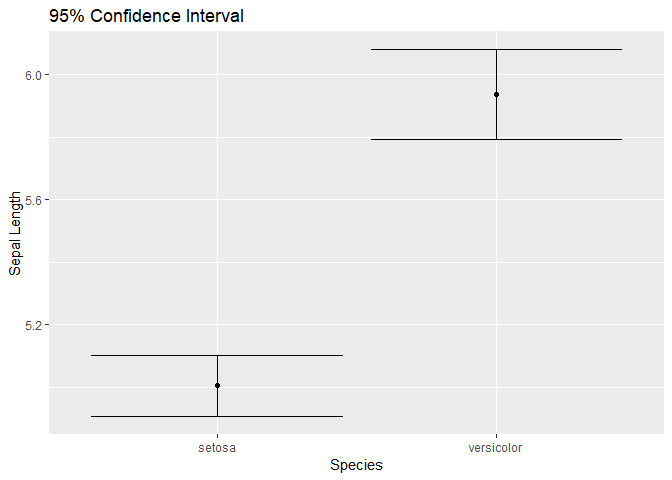
I was wondering, can you please help me with the R codes for generating the means with confidence interval for the two groups? For example, similar to the one that I showed in the lower left of the image.

Thank you again.

Naveed

Why dont you try using the code you from the earlier time you asked:

Thanks emma for the reply.

My previous query was regarding confidence interval for a single variable. However, here I want to generate CI for a variable for 2 of its different groups. So in this context, it would be a 95% CI plot for Sepal.Length for Species category 1 and another 95% CI plot for Sepal.Length for Species category 2. I would like to have both the CI plots side by side, like in the lower left of the image.

I tries but somehow I am not getting the codes. Can you please help me again?

Best

library(car)
#> Loading required package: carData
library(dplyr)
#> 
#> Attaching package: 'dplyr'
#> The following object is masked from 'package:car':
#> 
#>     recode
#> The following objects are masked from 'package:stats':
#> 
#>     filter, lag
#> The following objects are masked from 'package:base':
#> 
#>     intersect, setdiff, setequal, union
library(ggplot2)
#> Registered S3 methods overwritten by 'ggplot2':
#>   method         from 
#>   [.quosures     rlang
#>   c.quosures     rlang
#>   print.quosures rlang

dataset <- iris %>%
  select(Sepal.Length, Species) %>%
  filter(Species != "virginica") %>%
  mutate(Species = droplevels(x = Species))

leveneTest(y = (Sepal.Length ~ Species),
           data = dataset) # reject null hypothesis of homoscedasticity
#> Levene's Test for Homogeneity of Variance (center = median)
#>       Df F value   Pr(>F)   
#> group  1  8.1727 0.005196 **
#>       98                    
#> ---
#> Signif. codes:  0 '***' 0.001 '**' 0.01 '*' 0.05 '.' 0.1 ' ' 1

t.test(formula = (Sepal.Length ~ Species),
       data = dataset,
       var.equal = FALSE) # not assuming homoscedasticity
#> 
#>  Welch Two Sample t-test
#> 
#> data:  Sepal.Length by Species
#> t = -10.521, df = 86.538, p-value < 2.2e-16
#> alternative hypothesis: true difference in means is not equal to 0
#> 95 percent confidence interval:
#>  -1.1057074 -0.7542926
#> sample estimates:
#>     mean in group setosa mean in group versicolor 
#>                    5.006                    5.936

ggplot(data = dataset %>%
         group_by(Species) %>%
         summarise(cnt = length(Sepal.Length),
                   avg = mean(Sepal.Length),
                   std_dev = sd(Sepal.Length),
                   lwr_bd = (avg - (qnorm(p = 0.975) * std_dev / sqrt(x = cnt))),
                   upr_bd = (avg + (qnorm(p = 0.975) * std_dev / sqrt(x = cnt)))),
       mapping = aes(x = Species)) +
  geom_point(aes(y = avg)) +
  geom_errorbar(mapping = aes(ymin = lwr_bd,
                              ymax = upr_bd)) +
  labs(y = "Sepal Length",
       title = "95% Confidence Interval")


ggplot(data = dataset) +
  geom_boxplot(mapping = aes(x = Species,
                             y = Sepal.Length)) +
  labs(y = "Sepal Length",
       title = "Box Plot")

Created on 2019-06-16 by the reprex package (v0.3.0)

Hope this helps.

This topic was automatically closed 7 days after the last reply. New replies are no longer allowed.