Im having some problems plotting point and line in a single plot or graph. How I can plot the variable ‘HG’ versus ‘LG’ as points, and then adding other variable ‘AZ’ versus ‘LG’ as a line in the same plot ?
Excellent, make sense. Is possible create a legend with two different symbols ? I used this legend(#, #, legend=c("name", "name"),
col=c("darkmagenta", "black"), pch=4, lty=1, cex=0.8) but the legend only show one type of symbol.
you need to position a legend.
plot(mtcars$mpg,mtcars$drat)
lines(mtcars$mpg,mtcars$drat)
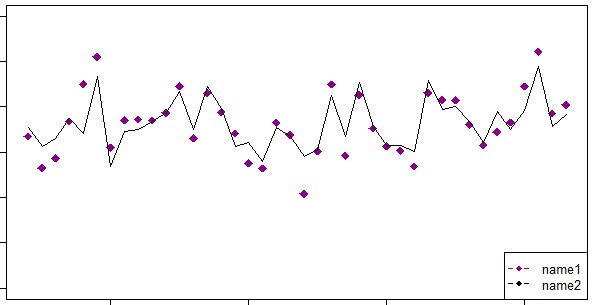
legend("bottomright",
legend=c("name1", "name2"),
col=c("darkmagenta", "black"),
pch=4,
lty=1,
cex=0.8)is not working, see my legend below
What isn't working ?
1 Like
Because name 1 is a point, and name 2 is a line.
plot(mtcars$mpg,mtcars$drat,type="p",pch=4,col="darkmagenta")
lines(mtcars$mpg,mtcars$wt,type="l",lty=1,col="black")
legend("bottomright",
       legend=c("drat", "wt"),
       col=c("darkmagenta", "black"),
       pch=c(4,NA),
       lty=c(NA,1),
       cex=0.8)
1 Like
Thanks, that was great!
This thread is continued at Different symbols in legend