Legend position and axis intervals

Hi there,

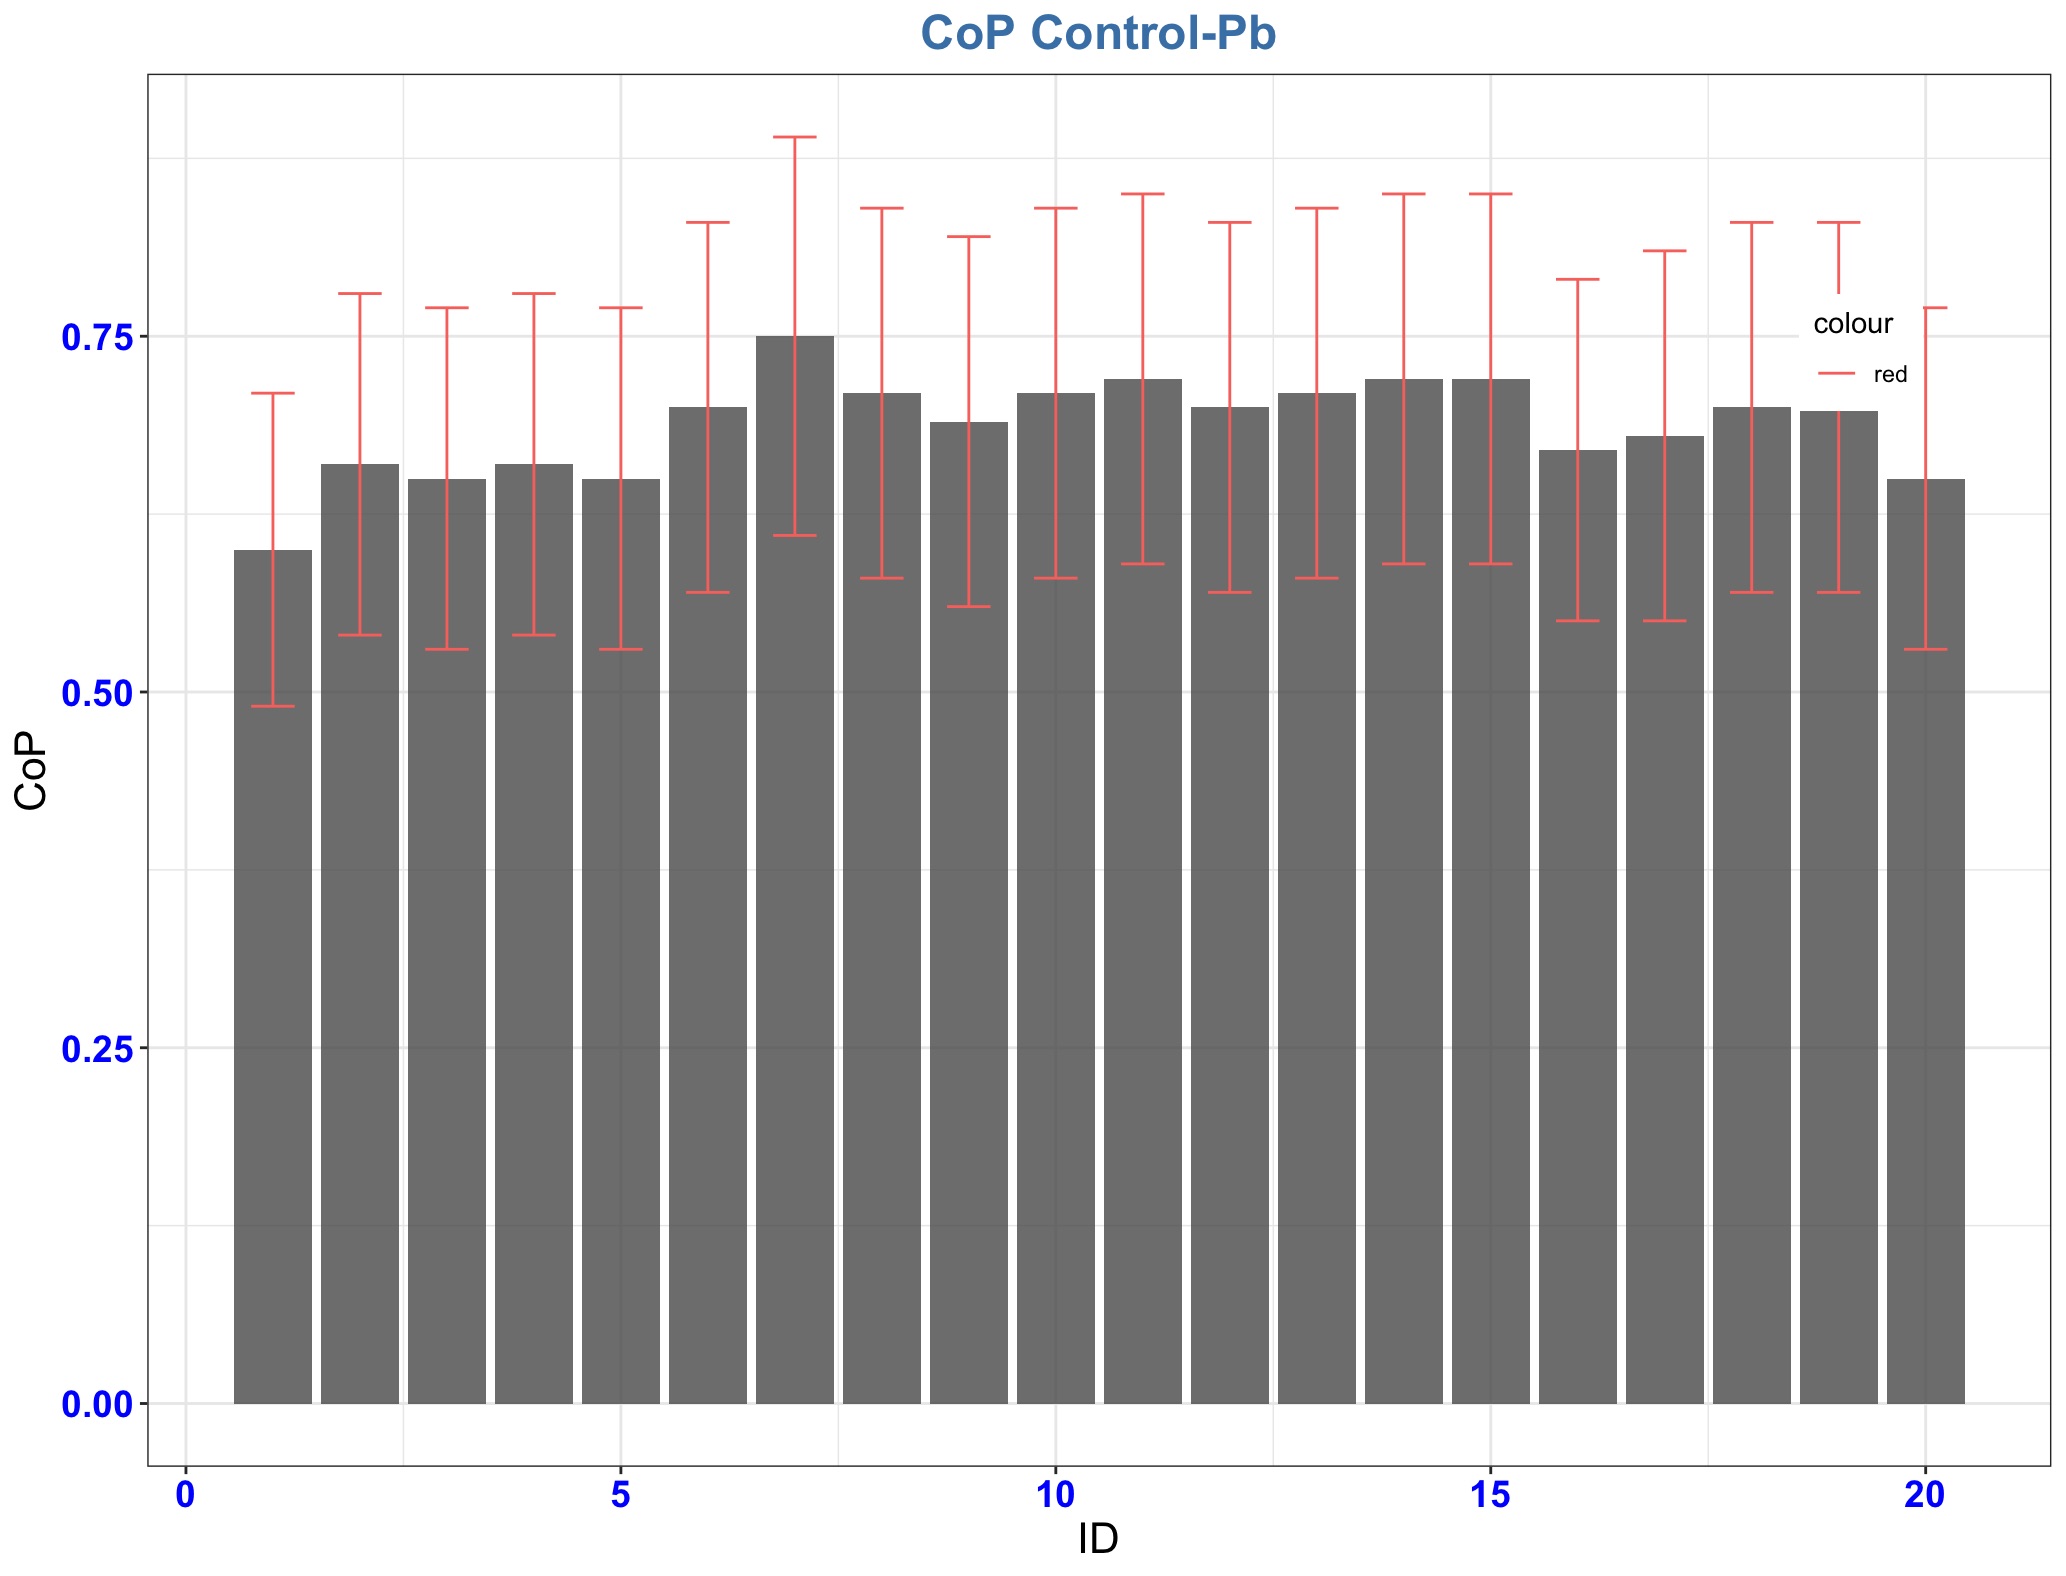
I'm looking to move the position of the legend when using 'ggplot', and which appears on my histogram in a position that covers up some of the error bars near the top right corner. The legend needs to be moved up a bit and further to the right.

Also, I would like to change axis number intervals, so instead of having 0, 0.25, 0.5, 0.75, 1.0 on the Y axis, I would like 0, 0.1, 0.2, 0.3 etc. I expect it's simple to do but can't locate the code for it easily.

So far my code is:

ControlPb %>% 
  ggplot(aes(ID,CoP))+geom_col(size=0.3,alpha=0.8)+
  labs(title="CoP Control-Pb")+geom_errorbar(aes(ID,ymin=CoP-ΔCoP,ymax=CoP+ΔCoP, width=0.5, color = "red"))+
  theme_bw()+
  theme(plot.title =
          element_text(size = 18, face = "bold", color = "steelblue", hjust = 0.5),
        axis.text = element_text(size = 14, color = "blue", face = "bold"),
        axis.title=element_text(size = 16))+theme(legend.position = c(0.9, 0.8))

Thanks

For the legend position, I think you have to use

theme(legend.position = "inside", legend.position.inside = c(0.9, 0.8))

For the y axis, try adding

scale_y_continuous(breaks = seq(0, 1, 0.1))

I don't have time to test those, so I hope they are correct.

Thank you. I will give them a go.

J

The Y-axis code works great but not the legend position. I have tried it in various places in the code and with various adjustments e.g.:

ControlPb %>% 
  ggplot(aes(ID,CoP))+geom_col(size=0.3,alpha=0.8)+
  scale_y_continuous(breaks = seq(0, 1, 0.1))+
  geom_errorbar(aes(ID,ymin=CoP-ΔCoP,ymax=CoP+ΔCoP, width=0.5, color = "red"))+
  labs(title="CoP Control-Pb")
  theme(plot.title =
          element_text(size = 18, face = "bold", color = "steelblue", hjust = 0.5),
        axis.text = element_text(size = 14, color = "blue", face = "bold"),
        axis.title=element_text(size = 16))+theme(legend.position = "inside", legend.position.inside = c(0.7, 0.7))

Is there a reference guide to this sort of syntax?

Thank you

Here are a couple of examples of positioning the legend. I must have been looking at an old web page when I saw the legend.position.inside parameter.
I don't see anywhere in your code where a plot aesthetic like color or fill depends on data. Fixed values like width = 0.5 and color = "red" should be outside of the aes() function.

library(ggplot2)
DF <- data.frame(ID = c("A","A","B","B"), Grp = c("C","D","C","D"), Y = c(0.02, 0.04, 0.025, 0.01))
ggplot(DF, aes(ID, Y, fill = Grp)) + geom_col(position = "dodge") +
  theme(legend.position = c(0.5, 0.75))


ggplot(DF, aes(ID, Y, fill = Grp)) + geom_col(position = "dodge") +
  theme(legend.position = c(0.25, 0.9))

Created on 2024-03-06 with reprex v2.0.2

Thank yu. I will have a play.

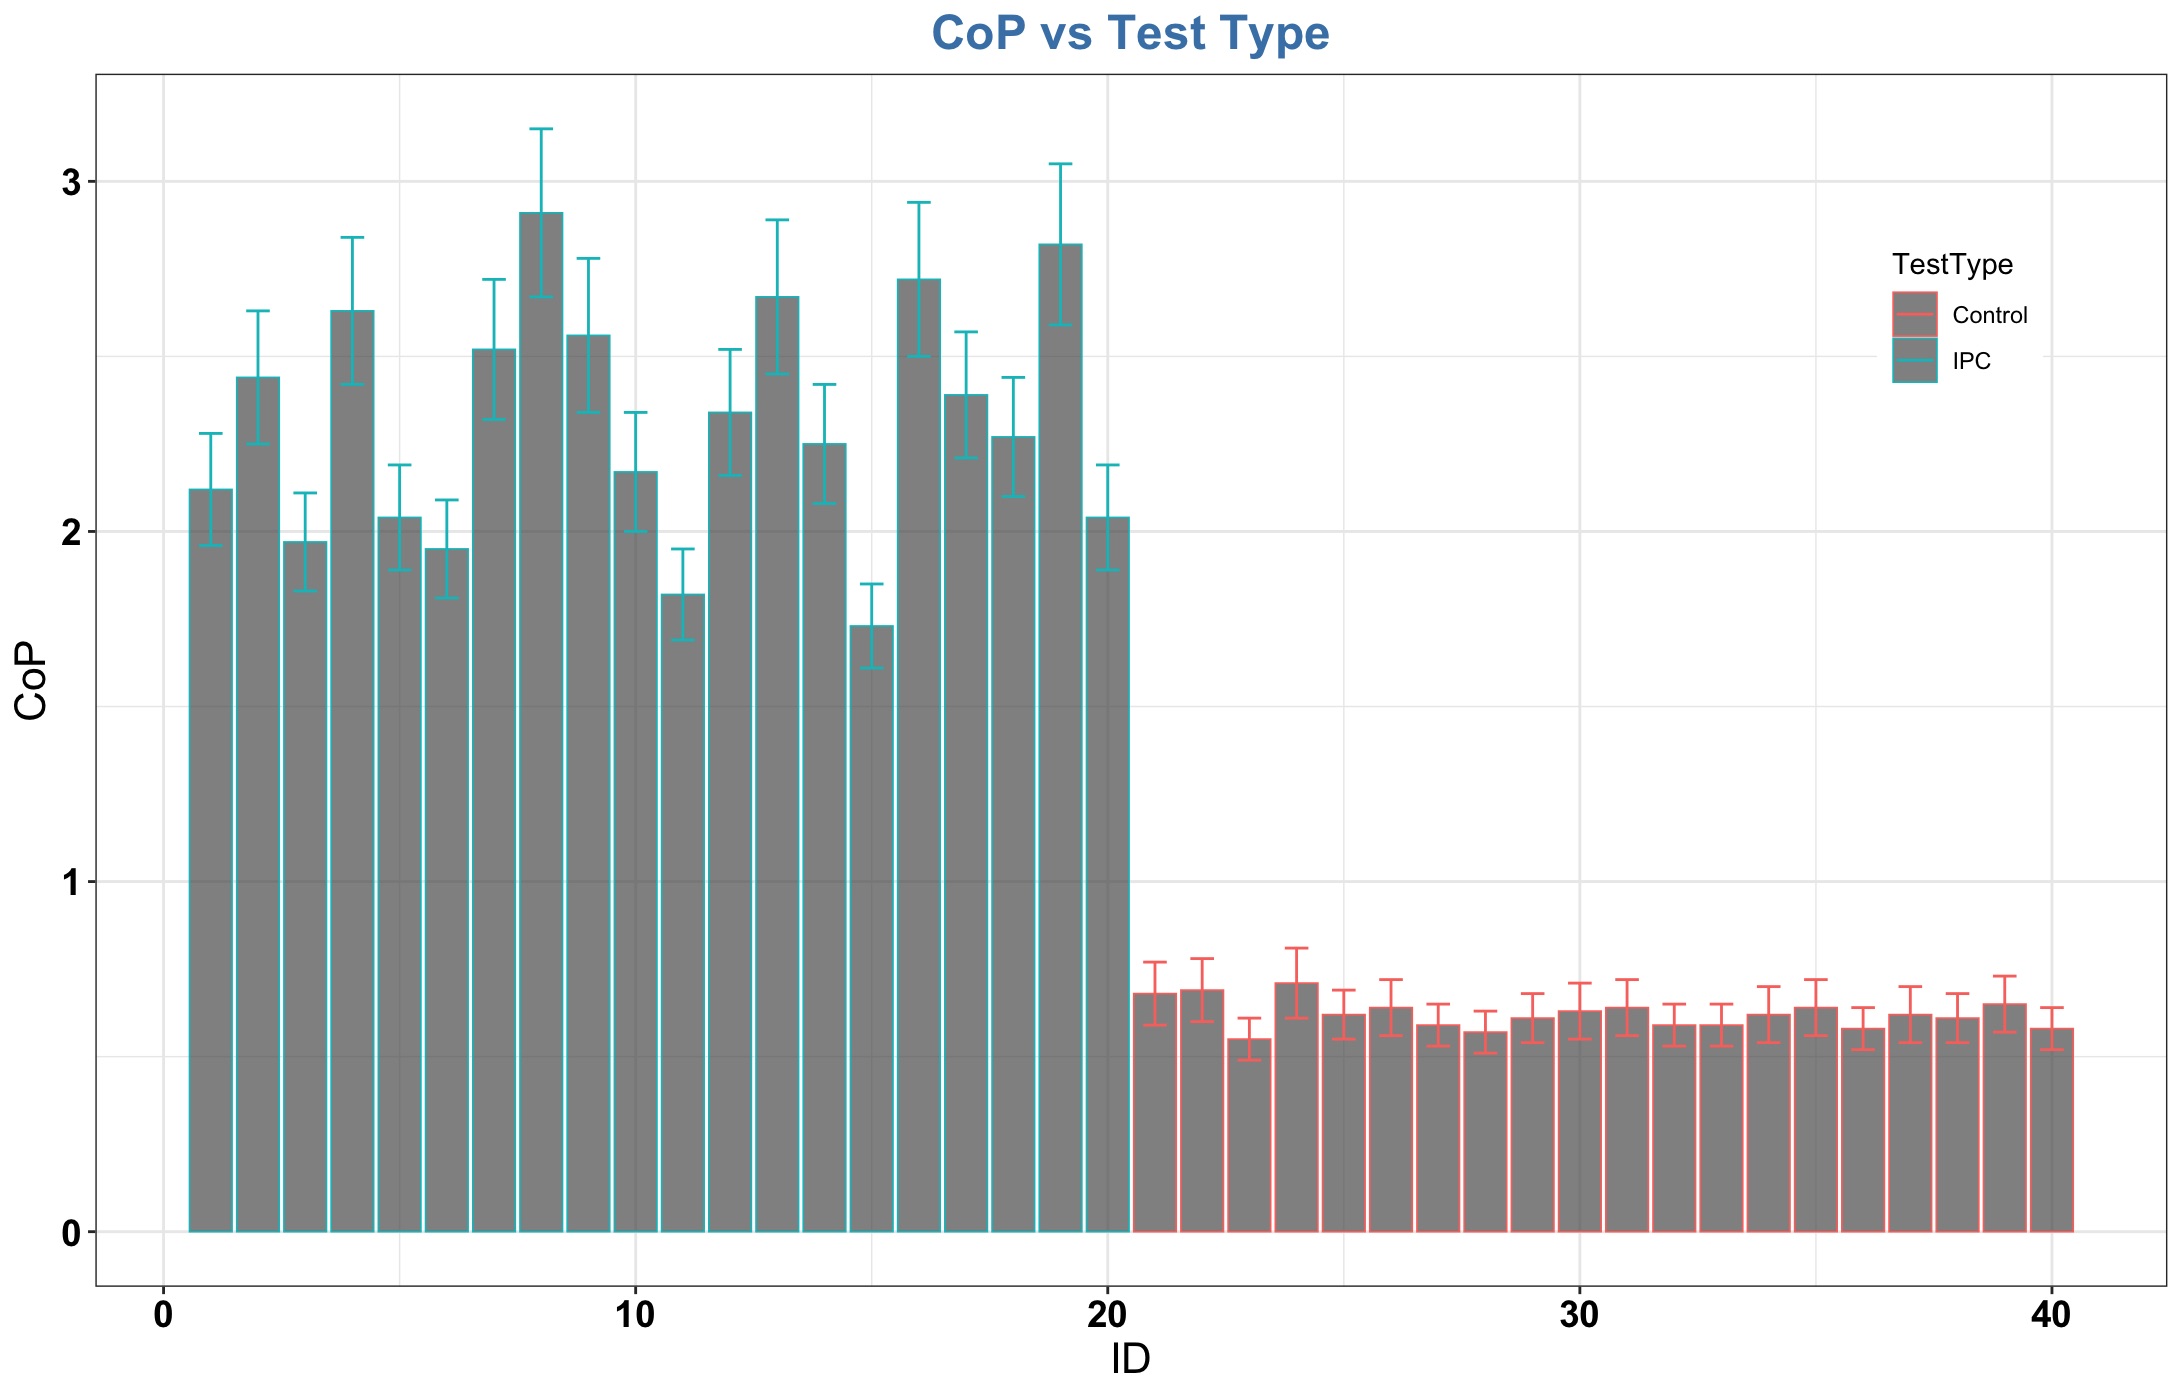
Yes, I want red for the error bars and which would be red when I used colour = 'TestType' to differentiate the two types of results. When I'm not using the two types of test, as in the code I showed, then if I just want the error bars to be red so they stand out then I tried: geom_errorbar(aes(ID,ymin=CoP-ΔCoP,ymax=CoP+ΔCoP, width=0.5, color = "red"))

Is that not the way to colour just that item?

Julian

It is better to use

geom_errorbar(aes(ID,ymin=CoP-ΔCoP,ymax=CoP+ΔCoP), width=0.5, color = "red")

Since width and color are constant, they should not be in the aes() function.

Here is what I am getting at the moment. In this example, I can do without the legend but would like to set the error bar colour.

I will show the other plot in another post

In the second example, I do want to be able to move the legend around if needed and the error bars are the same as the bar outlines which is fine as per the colour = TestType code

Here is an example with data roughly like yours. If the color is fixed to be "red", I agree you don't need the legend, so I didn't work with that case. You should set color = "red" outside of the aes() function, as in my post of a few minutes ago, so that you don't get a legend.

library(ggplot2)
DF <- data.frame(ID = 1:20, TestType = rep(c("IPC", "control"), each = 10), 
                 CoP = c(rnorm(10, 2.5,0.5), rnorm(10, 0.5, 0.1)),
                 DelCoP = c(rnorm(10, 0.2, 0.05), rnorm(10, 0.05, 0.02)))
ggplot(DF, aes(ID, CoP, color = TestType)) + geom_col() +
  geom_errorbar(aes(ymin = CoP - DelCoP, ymax = CoP + DelCoP)) +
  theme(legend.position = c(0.5, 0.75))


ggplot(DF, aes(ID, CoP, color = TestType)) + geom_col() +
  geom_errorbar(aes(ymin = CoP - DelCoP, ymax = CoP + DelCoP)) +
  theme(legend.position = c(0.8, 0.75))

Created on 2024-03-07 with reprex v2.0.2

That all works nicely :grinning:

This topic was automatically closed 21 days after the last reply. New replies are no longer allowed.

If you have a query related to it or one of the replies, start a new topic and refer back with a link.