Hi peeps!
I hope y'all are safe ![]()
I'm having a super weird issue with ggsave and I was wondering if someone has faced (and hopefully solved) something similar.
Basically, the legends of pdfs I generate using ggsave do not match what is displayed in RStudio's "Plots" window nor the legends of pdfs I generate using RStudio's "Export" option. This is happening for maps created using geom_sf.
Here's an example:
library(rnaturalearth) # gets data
library(ggplot2) # plots map
world <-
rnaturalearth::ne_countries(scale = "medium", returnclass = "sf") # creates a r object called "world" with spatial data
ggplot2::ggplot(data = world) + #starts plot with "world" as its data
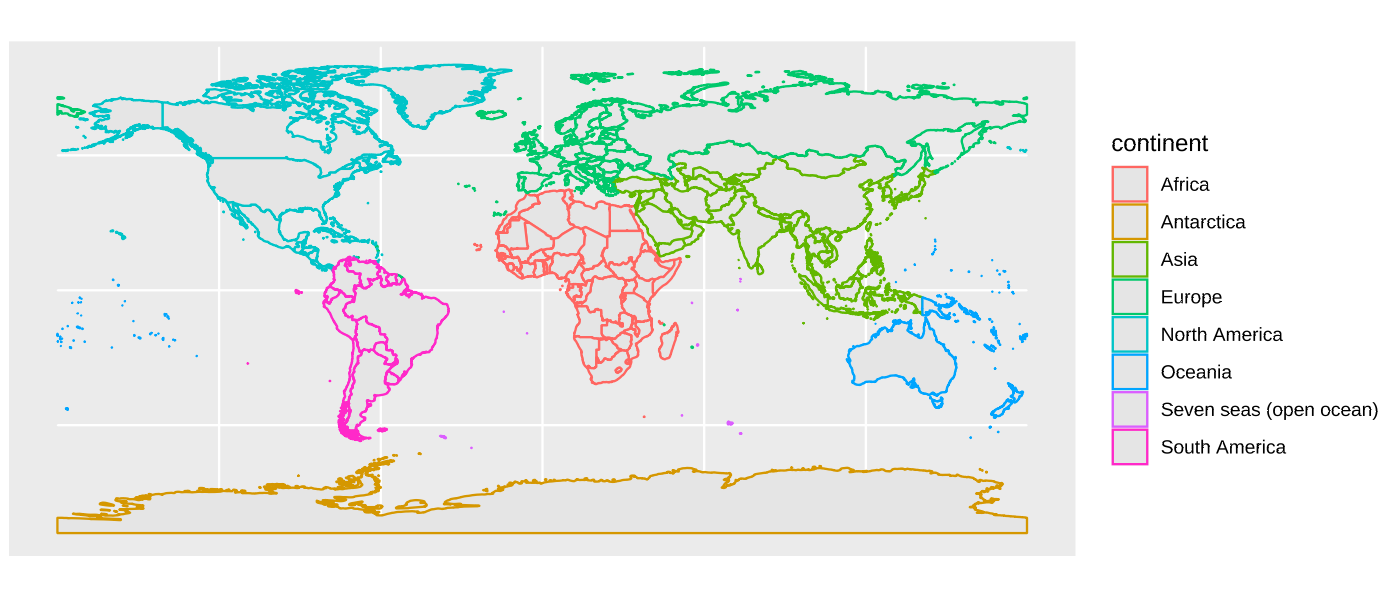
geom_sf(aes(color = continent), show.legend = "point") # draws map with colored continent outlines
Created on 2020-04-10 by the reprex package (v0.3.0)
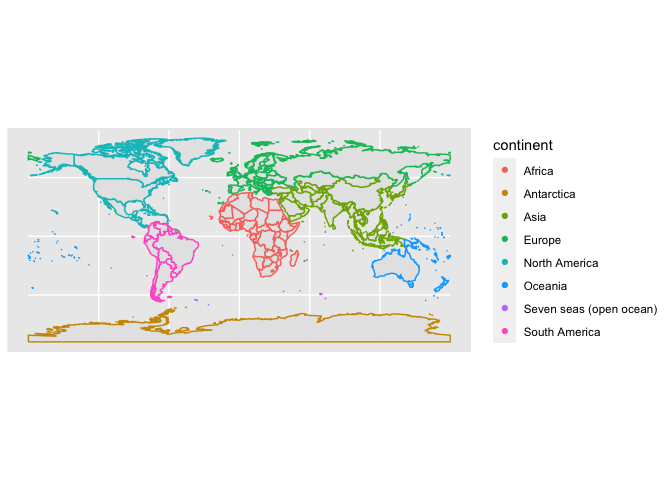
As you can see, the map above has points as its legend key. That is the output I wanted to get, however, when I use ggsave("ggsave_test.pdf") to save the map as a pdf file this is what I get:
The weird thing is that this problem seems to be exclusive to ggsave since saving the plot using RStudio's "Export" functionality or knitting a Rmarkdown document result in the plot having points as its legend key.
I think this might be a macOS-specific issue (or even something that is happening only in my computer) because this problem doesn't happen in rstudio.cloud.
Does anybody know why this might be happening and how to solve this issue?
Here's my session info in case it's useful:
R version 3.6.3 (2020-02-29)
Platform: x86_64-apple-darwin15.6.0 (64-bit)
Running under: macOS Catalina 10.15.4

Matrix products: default
BLAS:   /System/Library/Frameworks/Accelerate.framework/Versions/A/Frameworks/vecLib.framework/Versions/A/libBLAS.dylib
LAPACK: /Library/Frameworks/R.framework/Versions/3.6/Resources/lib/libRlapack.dylib

locale:
[1] en_US.UTF-8/en_US.UTF-8/en_US.UTF-8/C/en_US.UTF-8/en_US.UTF-8

attached base packages:
[1] stats     graphics  grDevices utils     datasets  methods   base

other attached packages:
[1] ggplot2_3.3.0       rnaturalearth_0.1.0

loaded via a namespace (and not attached):
 [1] Rcpp_1.0.4.6            compiler_3.6.3          pillar_1.4.3
 [4] class_7.3-16            tools_3.6.3             digest_0.6.25
 [7] evaluate_0.14           lifecycle_0.2.0         tibble_3.0.0
[10] gtable_0.3.0            lattice_0.20-40         pkgconfig_2.0.3
[13] rlang_0.4.5             DBI_1.1.0               cli_2.0.2
[16] rstudioapi_0.11         yaml_2.2.1              xfun_0.12
[19] rnaturalearthdata_0.1.0 e1071_1.7-3             withr_2.1.2
[22] dplyr_0.8.5             knitr_1.28              rgeos_0.5-2
[25] vctrs_0.2.4             tidyselect_1.0.0        classInt_0.4-2
[28] grid_3.6.3              glue_1.3.2              sf_0.9-0
[31] R6_2.4.1                fansi_0.4.1             rmarkdown_2.1
[34] sp_1.4-1                farver_2.0.3            purrr_0.3.3
[37] magrittr_1.5            scales_1.1.0            htmltools_0.4.0
[40] ellipsis_0.3.0          units_0.6-6             assertthat_0.2.1
[43] colorspace_1.4-1        KernSmooth_2.23-16      munsell_0.5.0
[46] crayon_1.3.4  ```

Cheers and thanks in advance!