I'm new using RStudio. I'm trying to show the distribution of temperature values (min,max and mean) in a graphic, my database is called 'datos_diarios' and I already imported the library, but it doesn't seem to work with this code...
It also shows the values on the X axis way too close and the can't be seen properly.
Thanks for providing code. Could you kindly take further steps to make it easier for other forum users to help you? Share some representative data that will enable your code to run and show the problematic behaviour.
How do I share data for a reprex?
You might use tools such as the library datapasta, or the base function dput() to share a portion of data in code form, i.e. that can be copied from forum and pasted to R session.
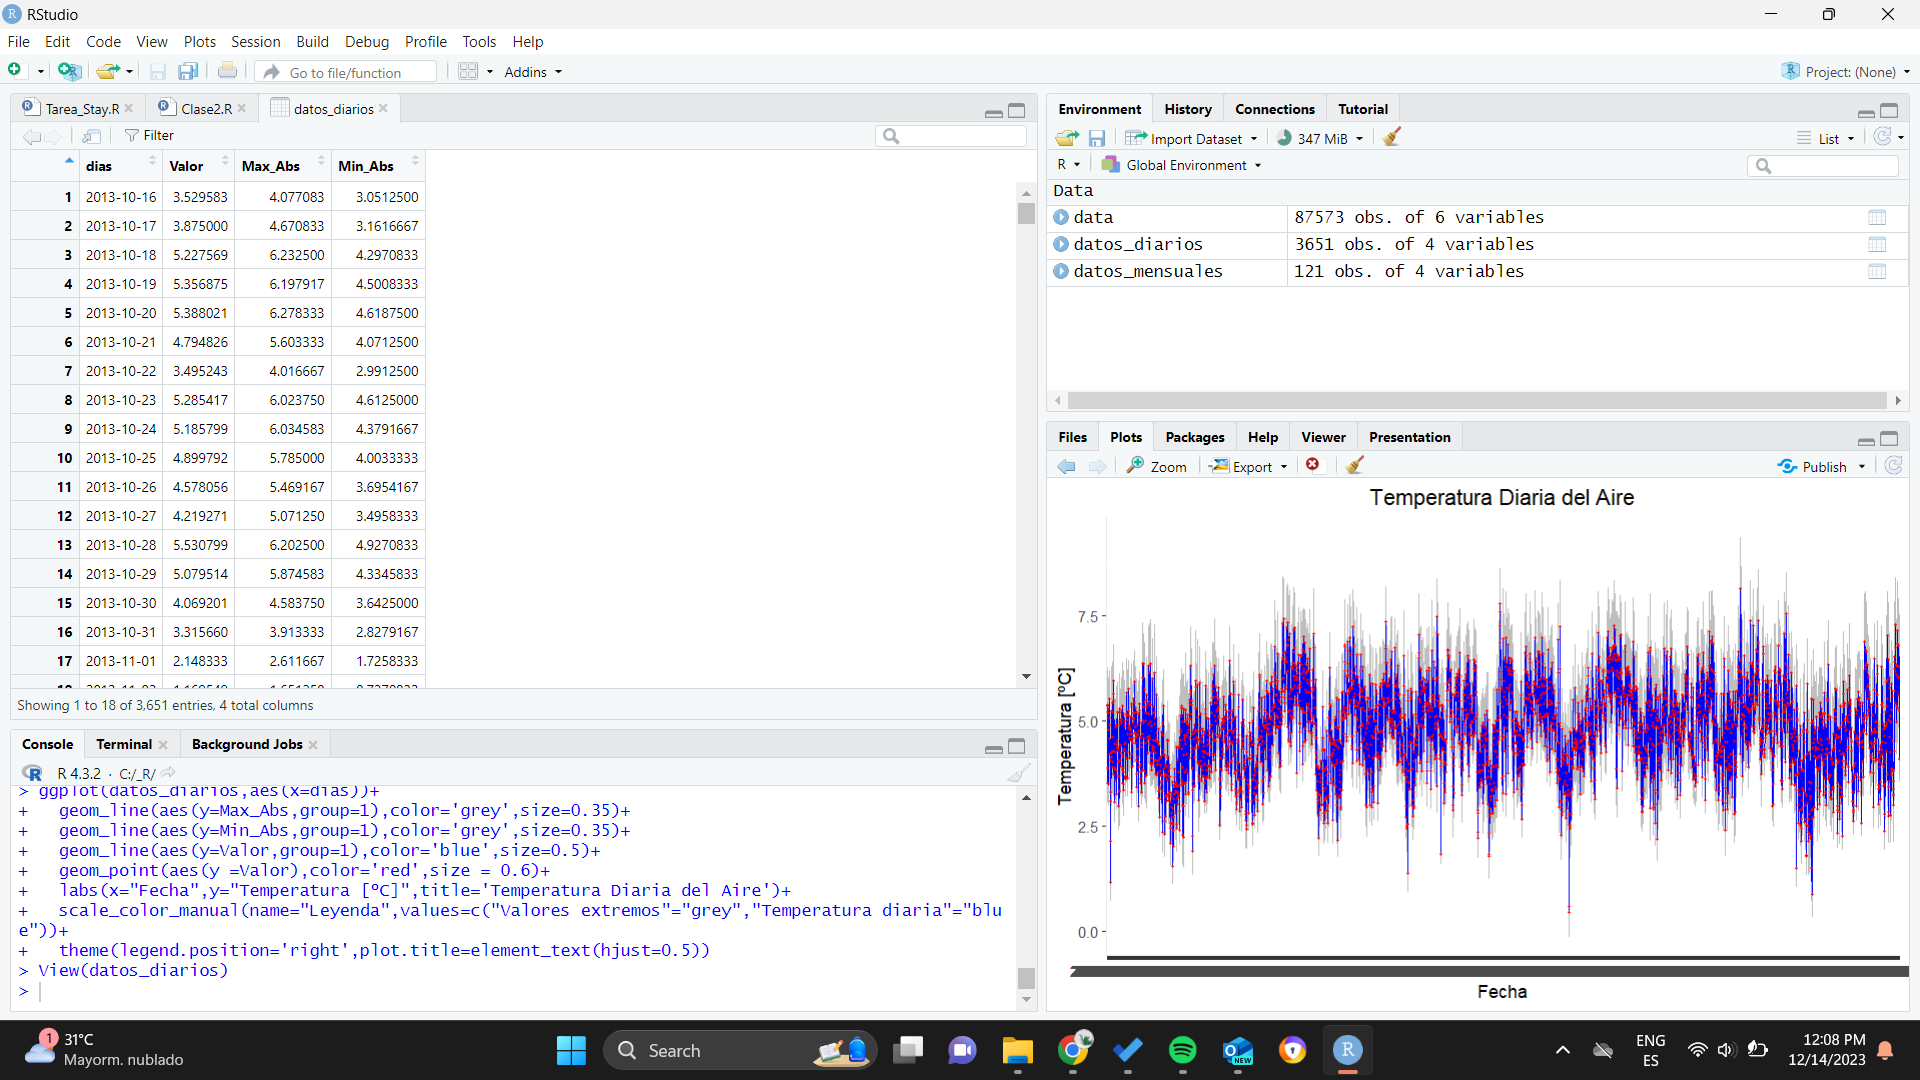
Screenshots are better than nothing.. but not great.
I would guess from that, that your date variable is simply not a date type, but probably a mere character string containing information that you percieve as dates, but that R doesnt consider, R thinks they are literal labels.
try using lubridate packages functions to make a date from it and try again.
there is an implied relationship between Fecha that you describe now and dias that you originally presented, but its unclear to me what it is. I struggle to explain what I havent been shown.
cutting them makes them into factors, if you want them as dates you shouldnt use cut etc.
# going from a datetime to a date i.e. only caring about days

(not_great <- cut(Sys.time(),breaks="day") )
str(not_great)

(better<- lubridate::as_date(Sys.time()))
str(better)