I've tried out the walk/walk2 function a few times today and I think I'm missing something.
My intention was to print a few plots and have the main title be different across each of them.
library(purrr)
library(dplyr)
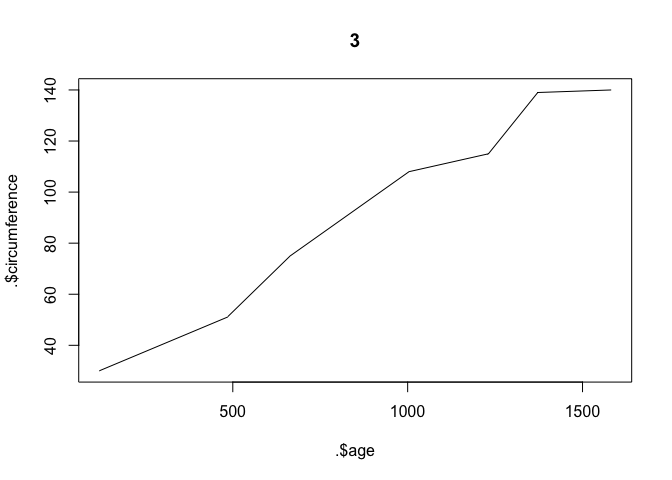
Orange %>%
   walk2(.x = .,
         .y = .$Tree,
         .f = ~plot(x = .x$age, y = .x$circumference, type = "l", main = .y))
I've tried throwing a group_by in there and not using the simplified formula structure:
Orange %>%
   group_by(Tree) %>%
   walk(.x = .,
        .f = function(.x, .y){plot(x = .x$age, y = .x$circumference, type = "l")})
Does anyone have some suggestions? ( reprex is unnecessary this is base r data)
A reprex would really be appreciated, it just makes it easier for everyone else to see what is going on with your code.
As a copy/paste of the first piece of code you show will not run due to a syntax error. Is that the issue you are having?
There is lot of high-powered help here who would like to help but without some idea of what the problem is you are running into it's going to be hard for them to give a hand. So an explanation of specifically what is not working as you expect it to would help too. A comment in the reprex where the unexpected output is would one way to do that, for example:
suppressPackageStartupMessages(library(purrr))
suppressPackageStartupMessages(library(dplyr))

# A syntax error occurs in this statement
Orange %>%
    walk2(.x = ., .
                .y = .$Tree,
                .f = ~plot(x = .x$age, y = .x$circumference, type = "l", main = .y))
#> Error: <text>:7:33: unexpected symbol
#> 6:         walk2(.x = ., .
#> 7:                                 .y
#>                                    ^
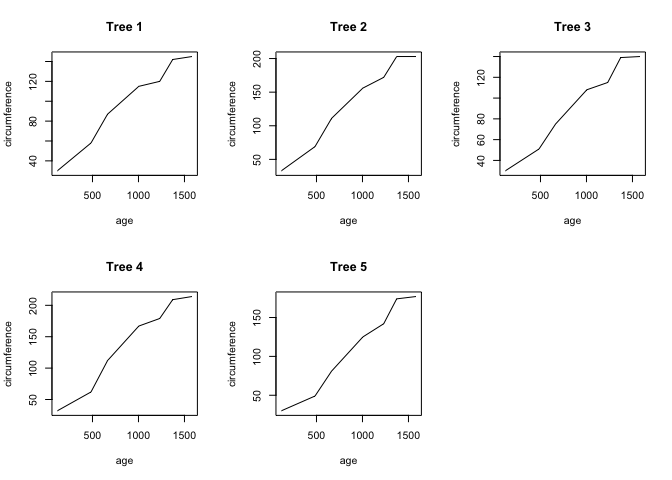
If you pass Orange directly into .x. or .y, walk2 will iterate over the variables, not the groups. To do that, split the data into a list. The names of the list elements will be the levels of whatever you split on, so they'll make nice titles:
library(purrr)

par(mfrow = c(2, 3))

Orange %>%
    split(.$Tree) %>%
    .[order(names(.))] %>%
    walk2(paste('Tree', names(.)),
          ~plot(circumference ~ age, data = .x, type = "l", main = .y))
This particular usage effectively rebuilds iwalk, with which you could write
Orange %>%
    split(.$Tree) %>%
    .[order(names(.))] %>%
    iwalk(~plot(circumference ~ age, data = .x, type = "l", main = paste('Tree', .y)))