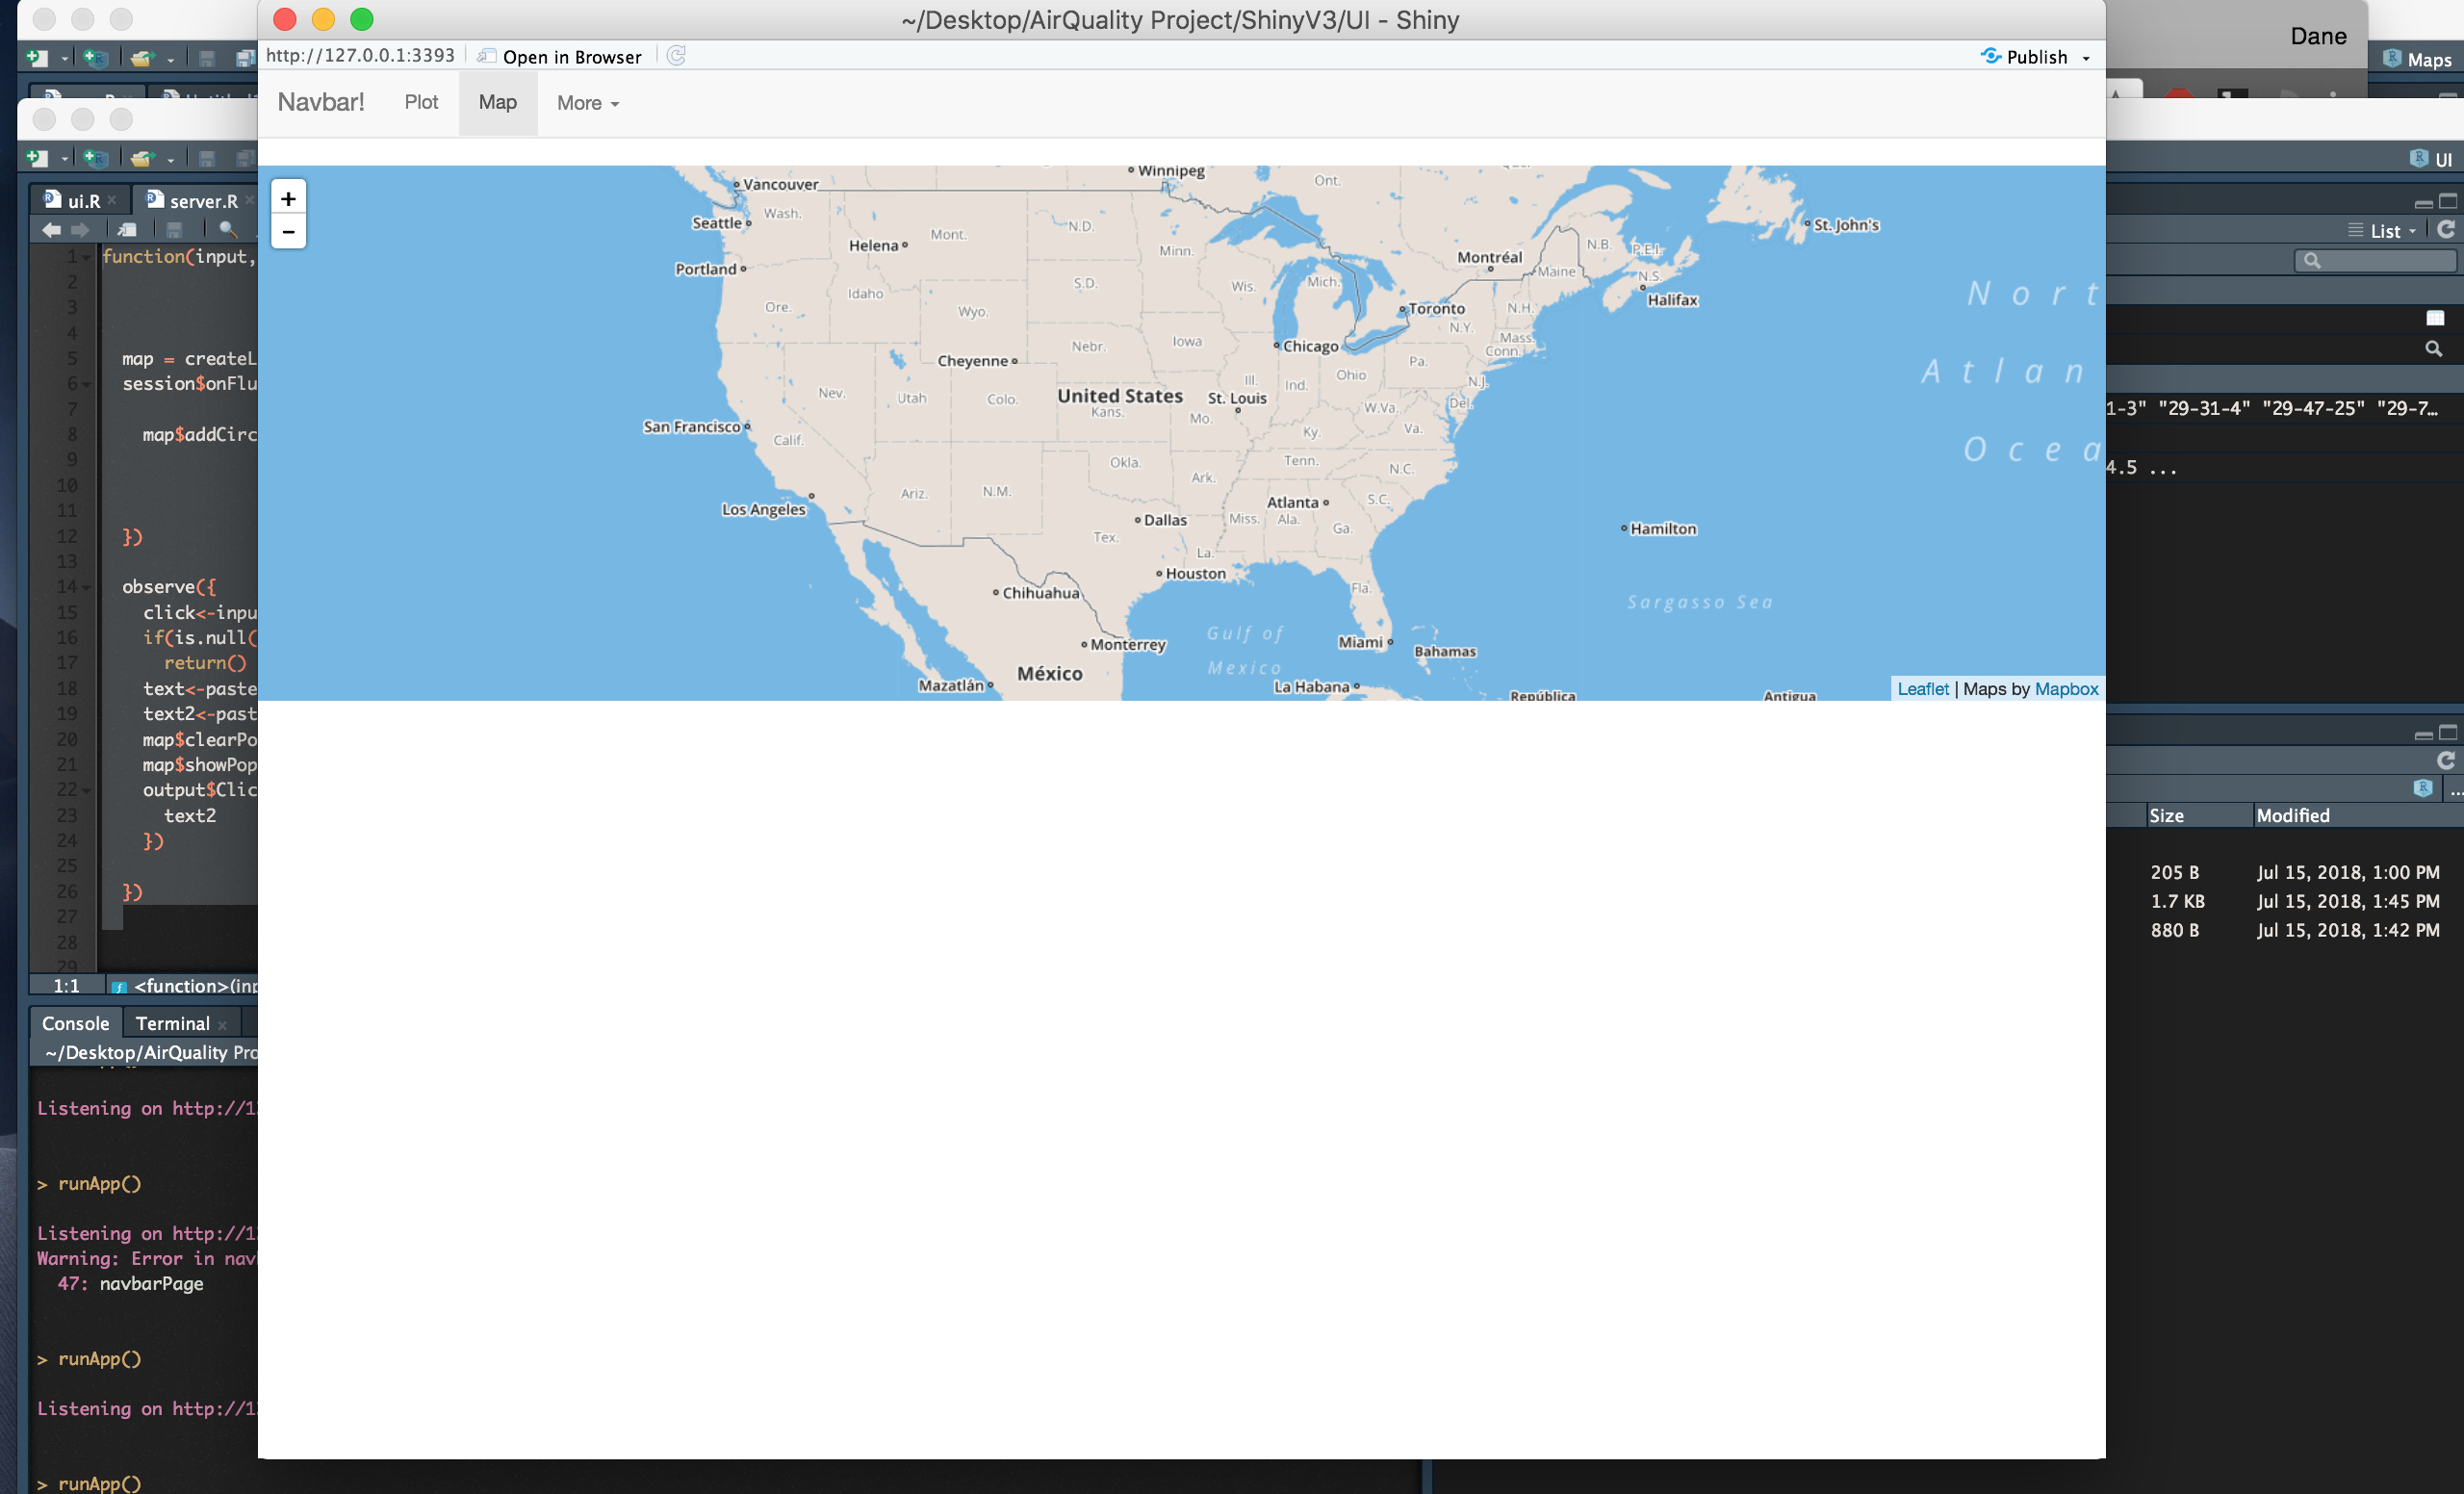
I trying to make a tab where users can select a location on a leaflet map on a separate tab. However, the map renders find but the circle markers do not. The code for the map and the circle markers works fine when not in a tabPanel layout.
Not Working ui.R
library(markdown)
library(shiny)
library(RSQLite)

db <- dbConnect(RSQLite::SQLite(), file.choose())
data <- dbGetQuery(db, "SELECT DISTINCT site,Latitude,Longitude FROM 'so.mo'")


latitude <- data$Latitude
longitude <- data$Longitude
#radius<-data$so
ids<-data$site

navbarPage("Navbar!",
           tabPanel("Plot",
                    sidebarLayout(
                      sidebarPanel(
                        radioButtons("plotType", "Plot type",
                                     c("Scatter"="p", "Line"="l")
                        )
                      ),
                      mainPanel(
                        plotOutput("plot")
                      )
                    )
           ),
           tabPanel("Map",
                    fluidRow(
                      leafletMap(
                        "map", "100%", 400,
                        initialTileLayer = "//{s}.tiles.mapbox.com/v3/jcheng.map-5ebohr46/{z}/{x}/{y}.png",
                        initialTileLayerAttribution = HTML('Maps by <a href="http://www.mapbox.com/">Mapbox</a>'),
                        options=list(
                          center = c(37.45, -93.85),
                          zoom = 4,
                          maxBounds = list(list(17, -180), list(59, 180))))),
                    fluidRow(verbatimTextOutput("Click_text"))
           ),
           navbarMenu("More",
                      tabPanel("Table",
                               DT::dataTableOutput("table")
                      ),
                      tabPanel("About",
                               fluidRow(


                               )
                      )
           )
)
Not working server.UI
function(input, output, session) {


  map = createLeafletMap(session, 'map')
  session$onFlushed(once=T, function(){

    map$addCircleMarker(lat = latitude,
                        lng = longitude,
                        radius = 5,
                        layerId=ids)
  })

  observe({
    click<-input$map_marker_click
    if(is.null(click))
      return()
    text<-paste("Lattitude ", click$lat, "Longtitude ", click$lng)
    text2<-paste("You've selected point ", click$id)
    map$clearPopups()
    map$showPopup( click$lat, click$lng, text)
    output$Click_text<-renderText({
      text2
    })

  })
code working without tabPanel
library(shiny)
library(leaflet)
db <- dbConnect(RSQLite::SQLite(), file.choose())
data <- dbGetQuery(db, "SELECT DISTINCT site,Latitude,Longitude FROM 'so.mo'")


latitude <- data$Latitude
longitude <- data$Longitude
#radius<-data$so
ids<-data$site

shinyApp(
  ui = fluidPage(
    fluidRow(
      leafletMap(
        "map", "100%", 400,
        initialTileLayer = "//{s}.tiles.mapbox.com/v3/jcheng.map-5ebohr46/{z}/{x}/{y}.png",
        initialTileLayerAttribution = HTML('Maps by <a href="http://www.mapbox.com/">Mapbox</a>'),
        options=list(
          center = c(37.45, -93.85),
          zoom = 4,
          maxBounds = list(list(17, -180), list(59, 180))))),
    fluidRow(verbatimTextOutput("Click_text"))),


  server = function(input, output, session){
    map = createLeafletMap(session, 'map')
    session$onFlushed(once=T, function(){

      map$addCircleMarker(lat = latitude,
                          lng = longitude,
                          radius = 5,
                          layerId=ids)
    })

    observe({
      click<-input$map_marker_click
      if(is.null(click))
        return()
      text<-paste("Lattitude ", click$lat, "Longtitude ", click$lng)
      text2<-paste("You've selected point ", click$id)
      map$clearPopups()
      map$showPopup( click$lat, click$lng, text)
      output$Click_text<-renderText({
        text2
      })

    })

  }
)