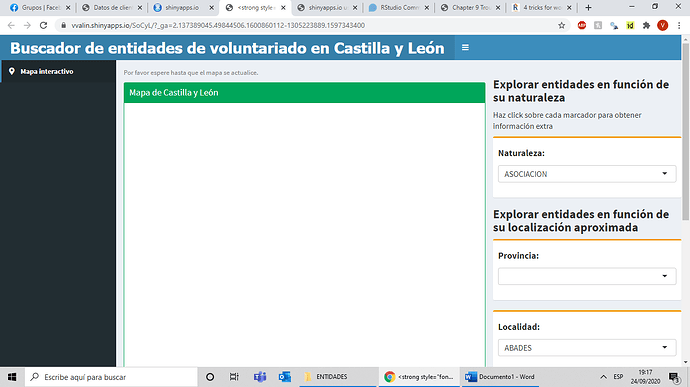
Please provide a sample of your dataframes: Voluntariado and limites
e.g. paste the output from dput(Voluntariado)
Anyway, this works for me:
library(shinydashboard)
library(leaflet)

Voluntariado <- data.frame(Provincia = "Waikato", Localidad = "Hamilton", Dirección = "North")

# create the header of the Shiny Dashboard
header <- dashboardHeader(
  title = strong("Buscador de entidades de voluntariado en Castilla y León", style = "font-family: 'Tahoma'; font-size: 30px;", img(src = "pin.png", height = 40)), # add title with a map icon
  titleWidth = 900
)

# create sidebard of Shiny Dashboard
sidebar <- dashboardSidebar(
  sidebarMenu(id = "tabs", menuItem(strong("Mapa interactivo"), # strong indicates bolded
    tabName = "Map", icon = icon("map-marker")
  ))
)

body <- dashboardBody(
  tabItems(tabItem(
    "Map",
    tags$style(
      type = "text/css", # specify font type and size for the dashboard body for the map tab
      "label { font-size: 16px; }", # all labels are 16 pixel font
      ".selectize-input { font-size: 16px;} ", # the titles of the text inputs and drop-down menus are 16 pixels
      ".selectize-dropdown { font-size: 16px; }",
      "#Municipio { font-size: 16px; }", # increase the size of the city and address labels on the text input
      "#Dirección { font-size: 16px; }",
      "#Provincia { font-size: 16px; }"
    ),

    # create columns
    fluidRow(
      column(
        width = 8, HTML("<div style='height: 600px;'>"), # set height of the box the map is in so that it lines up with the right-hand boxes
        p("Por favor espere hasta que el mapa se actualice.", style = "color:grey; font-size:10pt"), # add a notification above the map
        box(
          width = NULL, status = "success", solidHeader = TRUE, title = "Mapa de Castilla y León", # create a green box that has the map
          leafletOutput("map2", height = 940)
        ), # show map in this box
        HTML("</div>") # add some space at the bottom of the map
      ),

      column(
        width = 4, style = "padding:0px;", # add padding so that the title of this box lines up with the map
        h3(strong("Explorar entidades en función de su naturaleza")), # add bolded title to this column
        p("Haz click sobre cada marcador para obtener información extra", style = "font-size:12pt"),

        box(
          width = NULL, status = "warning", # add red box that includes a drop-down menus for specialty (changes markers on map)
          selectInput("specialty", h4(strong("Naturaleza:")), c(
            "ASOCIACION", "FUNDACION", "INSTITUCIONES, ORDENES, CONGREGACIONES RELIGIOSAS Y SIMILARES",
            "FEDERACION-CONFEDERACION", "ADMINISTRACION LOCAL", "PATRONATO DE ENTIDADES SIN FIN DE LUCRO PUBLICAS",
            "SOCIEDADES", "ADMINISTRACION AUTONOMICA"
          ))
        ),

        h3(strong("Explorar entidades en función de su localización aproximada")),

        box(
          width = NULL, status = "warning",
          selectInput("Provincia", h4(strong("Provincia:")), choices = sort(Voluntariado$Provincia))
        ),
        box(
          width = NULL, status = "warning",
          selectInput("Localidad", h4(strong("Localidad:")), choices = sort(Voluntariado$Localidad))
        ),


        h3(strong("Explorar entidades por localización exacta")), # add a title for the next box

        box(
          width = NULL, status = "primary",
          selectInput("address", h4(strong("Dirección")), choices = sort(Voluntariado$Dirección)), # the user inputs address
          p(em("Ejemplo: CALLE LOPE DE VEGA 1, 47010, VALLADOLID	", style = "color:red; font-size:12pt"))
        )
      )
    ), # add a notification that is italicized indicating an example address in Birmingham, AL

    fluidRow(
      column(
        width = 2, offset = 8,
        box(width = NULL, status = "info", actionButton("geocode", h4(strong("Búsqueda"))))
      ), # add a button that the user pushes to geocode inputted address and draws a circle
      column(
        width = 2, offset = 8,
        box(width = NULL, status = "danger", actionButton("clear", h4(strong("Limpiar"))))
      ) # add a button to clear the geocoded address and circle
    )
  ))
)

ui <- dashboardPage(
  header, # put entired dashboard together
  sidebar,
  body
)

Server <- function(input, output, session) {

  icons <- awesomeIcons(
    icon = "ios-close",
    iconColor = "black",
    library = "ion"
  )

  output$map2 <- renderLeaflet({
    leaflet() %>%
      addTiles(
        urlTemplate = "//{s}.tile.openstreetmap.org/{z}/{x}/{y}.png",
        options = tileOptions(minZoom = 7, maxZoom = 16)
      ) %>%
      setView(lng = -4.7286749, lat = 41.6524094, zoom = 7)
    # %>%
    #   addPolygons(data = limites, fillColor = "green")
  })
}

shinyApp(ui, Server)
![]()
