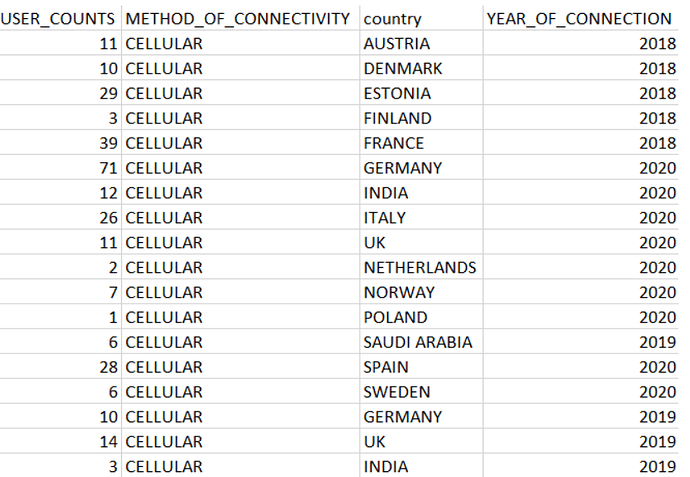
I have a sample data set with 4 columns
Year_of_connection
country
Method_of_connection
User_Counts
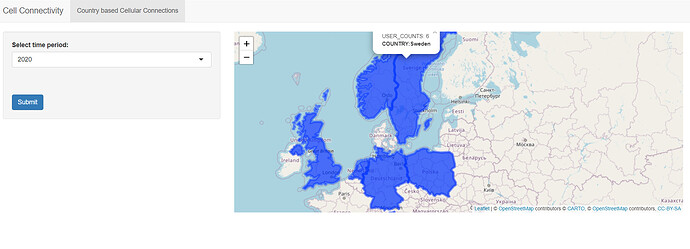
I am trying to create a dashboard using Shiny where the user is requested to input the year using a slider input and click the submit button. Upon clicking submit the output should be a leaflet map only for the year selected and reflecting User_counts from various countries
I followed the steps of getting the shapefile , ShapepolygonDataFrame using the maps package and then am trying to merge the shapefile with the dataframe - the dataframe is generated when user selects a set of specific dates only.
However, I am unable to see the selected countries on the map. Infact I see all countries from the shapefile
What am I doing wrong or have missed ?
you can observe that its plotting all countries rather than those only that are to be selected for the year via the slider input
###Code
library(shiny)
library(shinydashboard)
library(lubridate)
library(sp)
library(sf)
library(maps)
library(maptools)
library(leaflet)
library(stringr)
library(dplyr)
#Read the file
my_data <- read.csv(file.choose(),header = T)
#my_data$YEAR<-year(my_data$DATE_OF_CONNECTION)
#get shape files from world map
world <- map("world", fill=TRUE, plot=F)
world_map <- map2SpatialPolygons(world, sub(":.*$", "", world$names))
world_map <- SpatialPolygonsDataFrame(world_map,
data.frame(country=names(world_map),
stringsAsFactors=FALSE), FALSE)
world_map$country <- str_to_upper(world_map$country)
Take a subset of spatialPolygonDataFrame only for countries that match your dataset
t2 <- subset(world_map, country %in% my_data$country)
Define UI
ui <- navbarPage("Cell Connectivity",
             tabPanel("Country based Cellular Connections",
                      sidebarLayout(
                          sidebarPanel(

                              sliderInput("val",
                                          "YOC:",
                                          min = 2015,
                                          max = 2021,
                                          value = 2018, #value is the starting value so should be value within date range
                                          sep="",
                                          ticks = FALSE),

                              br(),
                              br(),


                              submitButton("Submit")

                          ),


                          #
                          mainPanel(

                              leafletOutput("map")


                          )
                      )


             )
)
Define server logic required to draw a histogram
server <- function(input, output) {
selected <- reactive({
     my_data[my_data$YEAR_OF_CONNECTION == input$val ,]


})


output$map <- renderLeaflet({
    # Use leaflet() here, and only include aspects of the map that
    # won't need to change dynamically (at least, not unless the
    # entire map is being torn down and recreated).
    leaflet(t2) %>%
        addProviderTiles("CartoDB.Positron")


})


observe({
    if(!is.null(input$val)){
      #t2@data <- left_join(t2@data, selected, by="country")


        t2@data <- inner_join(t2@data, selected(),by="country")

         #t3 <- merge(world_map, selected(),by.x="country",by.y="country",all.y= TRUE)


        leafletProxy("map", data =  t2) %>%

            #addTiles() %>%
            clearShapes() %>%
            addPolygons(data = t2,

                        fillOpacity = 0.7,
                        color = "Blue", weight = 2)

    }

})
}
Run the application
shinyApp(ui = ui, server = server)
.###End

