Leaflet: Clickable CircleMarkers & Polygons in one map

Hi,

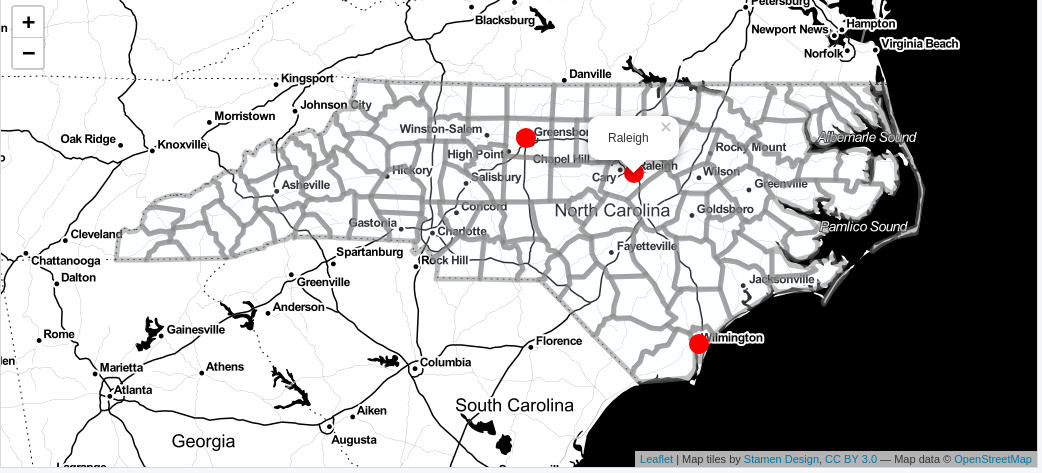
I am wondering whether is possible to have both clickable Markers as well as Polygons in one leaflet map? Polygons are meant to cover regions in my map and are supposed to return summary statistics for the given regions when clicked. Markers stand for individual venues and should return summary statistics for the given venue. When plotting both, only Polygons display the hover info (which kinda makes sense). Wondering whether there is some workaround (other than having radiobuttons to change between Markers/Polygons on one map). Thanks!

Yes, you can; consider this example (built on the standard North Carolina shapefile):

library(leaflet)
library(dplyr)
library(sf)

# NC counties - a shapefile shipped with the sf package
shape <- st_read(system.file("shape/nc.shp", package ="sf")) %>% 
  st_transform(shape, crs = 4326)
  

# three cities with coordinates
points <- data.frame(name = c("Raleigh", "Greensboro", "Wilmington"),
                     x = c(-78.633333, -79.819444, -77.912222),
                     y = c(35.766667, 36.08, 34.223333)) %>% 
  st_as_sf(coords = c("x", "y"), crs = 4326)

leaflet() %>% 
  addProviderTiles("Stamen.Toner") %>% 
  addPolygons(data = shape, 
              fillColor = "aliceblue", 
              color = "grey",
              popup = ~NAME) %>%  # county name, note the tilde!
  addCircleMarkers(data = points, 
                   fillColor = "red", 
                   color = NA,
                   radius = 10,
                   fillOpacity = 1,
                   popup = ~name) # city name, again tilde convention

For more Leaflet tuning options have a look at my post here:

2 Likes

My bad, I forgot that I had "bringToFront = TRUE" used in my polygons. Your solution helped me to figure it out. Díky!

1 Like

This topic was automatically closed 7 days after the last reply. New replies are no longer allowed.