Leaflet (addLegend) don't show color scale with comma as decimal mark.

I need to print a PDF report with Rmarkdown, which presents decimals with comma separator (e.g. 2,5; 0,0123; etc,). Using options(OutDec = ","), I get all my decimal numeric output to be presented with comma: inline text, graphs, tables and the values presented in maps using leaflet.

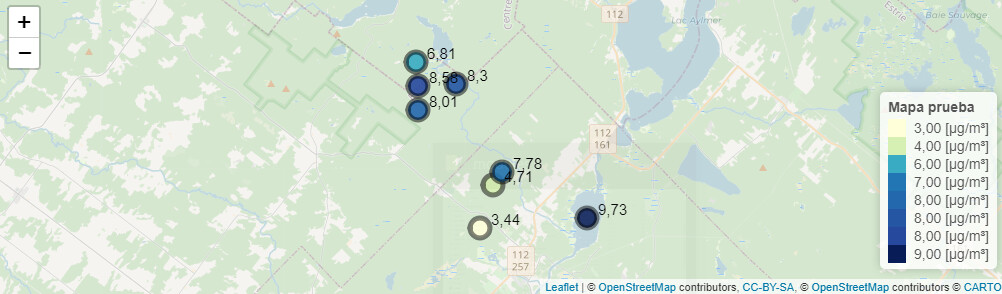
However, the leaflet legend is not configured and the color scale does not appear.

I have not been able to configure leaflet to show the legend with the color scale and the numbers with decimal separator comma.

This is an code example:

library(tidyverse)
library(tibble)
library(leaflet)
library(leaflegend)

id <- as.tibble(c("a", "b", "c", "d", "e", "f", "g", "h"))
lat <- as.tibble(c(45.72643, 45.72149, 45.74190, 45.74855, 45.79040, 45.77804, 45.78961, 45.80105))
long <- as.tibble(c(-71.41670, -71.49019 ,-71.48091 ,-71.47479, -71.50638, -71.53254, -71.53285, -71.53381))
val <- as.tibble(c(9.73, 3.44, 4.71, 7.78 ,8.30, 8.01, 8.58, 6.81))

valores <- bind_cols(id,lat,long,val) %>% rename(id = 1, lat = 2, long = 3, val = 4)

options(OutDec = ",")

pal <- colorNumeric(palette = "YlGnBu",
                    domain = valores$val)

leaflet(valores) %>%
  addTiles() %>%
  addCircleMarkers(~long, # Longitud
                   ~lat, # Latitud
                   radius = 10,
                   color = "black",
                   fillColor = ~ pal(val),
                   label = ~ val,
                   labelOptions = labelOptions(noHide = T, 
                                               textOnly = TRUE,
                                               style = list("color" = "black",
                                                            "font-family" = "arial",
                                                            "font-style" = "bold",
                                                            "font-size" = "15px",
                                                            "text-align" = "center"),
                                               offset = c(10,-8),
                                               direction = "right"),
                   stroke = TRUE,
                   fillOpacity = 0.9) %>% 
  addProviderTiles(providers$CartoDB.Positron,
                   options = providerTileOptions(opacity = 0.50)) %>%
  leaflet::addLegend("bottomright",
                     pal = pal, 
                     values = ~val,
                     title = "Mapa prueba",
                     labFormat = labelFormat(suffix = " [\u00b5g/m\u00b3]"),
                     opacity = 1)

Thank you.

HI @Lekmonm. Below is one approach I believe gets to the desired outcome. Just before creating the leaflet plot, I created Val, Pal, and Labels, which are three explicit vectors. Passing these values into the leaflet code (designated with # New) produce a legend with the color scale and values presented with a comma. This example shows each specific value in the legend.

pal <- colorNumeric(palette = "YlGnBu",
                    domain = sort(valores$val) # New sort
                    )

Val = sort(val$value)
Pal = pal(Val)
Labels = paste(Val, '[\u00b5g/m\u00b3]')

leaflet(valores) %>%
  addTiles() %>%
  addCircleMarkers(~long, 
                   ~lat, 
                   radius = 10,
                   color = "black",
                   fillColor = Pal, # New
                   label = Val,
                   labelOptions = labelOptions(noHide = T, 
                                               textOnly = TRUE,
                                               style = list("color" = "black",
                                                            "font-family" = "arial",
                                                            "font-style" = "bold",
                                                            "font-size" = "15px",
                                                            "text-align" = "center"),
                                               offset = c(10,-8),
                                               direction = "right"),
                   stroke = TRUE,
                   fillOpacity = 0.9) %>% 
  addProviderTiles(providers$CartoDB.Positron,
                   options = providerTileOptions(opacity = 0.50)) %>%
  leaflet::addLegend("bottomright",
                     colors = Pal, # New
                     values = Val, # New
                     title = "Mapa prueba", 
                     labels = Labels, # New
                     opacity = 1)

If you don't want to show explicit values in the legend, you can make the following edit to Labels.

Labels = paste0(floor(Val), ',00 [\u00b5g/m\u00b3]')

1 Like

Thank you, very much. It works very good.

Regarding the solution, I just removed sort(), since it was sorting the results and wrongly assigning colors to the circular markers.

This topic was automatically closed 7 days after the last reply. New replies are no longer allowed.

If you have a query related to it or one of the replies, start a new topic and refer back with a link.