Leaflet - add multipe Polylines to map

I am able to add one polyline of class SpatialLines to a map, but am unable to add multiple polylines that are in a list. Is there a method for adding a list of SpatialLines to a map using the addPolylines layer?

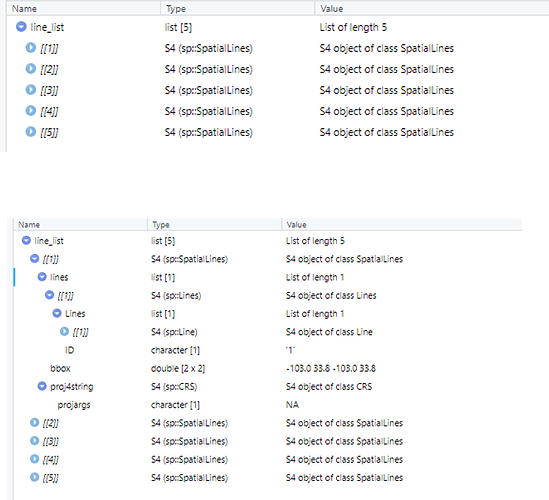
The following works for one polyline when I specify an index in the line_list, i.e. line_list[[1]], but how can I display all lines in the list (attached image) in the addPolyline function:

map <- leaflet() %>%
addPolylines(data = line_list[[1]])
)

Still unable to figure this out and seeking some guidance.

I'm able to add one SpatialLines object to Leaflet using the addPolyline function. My object looks like this:

class : SpatialLines
features : 1
extent : -103.0479, -103.0476, 33.80706, 33.82168 (xmin, xmax, ymin, ymax)
crs : NA

Now, I have hundreds of these objects to show on a map and would like to add them using just one addPolyline function.

addPolyline has a 'data' argument which when set to equal my one object displays properly in leaflet. When I try to set data equals a list of many SpatialLines I get an error 'Don't know how to get path data from object of class list'.

I believe readers here will need some usable data and perhaps more of your code to be able to help.

Have a look at

agree, it's just the spatialLine files are lists and I was not sure how to provide examples of this to the reader You'll see my previous posts follow reprex....I'll rework this entry.

thx

?dput

A very simple and very effective way to supply some data is to use the dput() command.

dput(mydata)

where mydata is the name of your dataframe, tibble, list, matrix, .... and then simply copy the output and paste it here. If you have a very large data set then a sample should be fine.

Do you have a compelling reason to keep the lines object in list form? I am a man of limited imagination, but I can't think of any advantage this would have in plotting.

I would suggest creating a technical object of class sf data frame that would be union of all your lines, one that would inherit only geometry and perhaps one or two data columns (leaflet polylines can carry information by the means of color and width, which is about it).

{purrr} should be your friend in achieving this. This object should you help in drawing the map, and can be easily discarded afterwards, if required.

thanks for your suggestion. I'll research your idea, could you tell me more about how to union spatialLines from a list of spatialLines?

My use case which works right now is the interactive display of linear assets. For example, I can show a road system thru one addPolylines layer by passing in a wkt shape_geography object (dataframe of wkt linestring) which has been converted to a spatialLines object through rgeos::readWKT. This is how I get shape_geography formatted fields from SQL server into a leaflet map in shiny.

Now, I have second addPolylines layer which, for example is bridges, all stored in a similar SQL table. The user wants the ability to select one or more bridges in a dataframe and display these on a map. It's of no use to just show a layer of all bridges, they want control of which one(s) to show. I currently have the user select one bridge to show, and selecting more than one is not recognized through addPolylines. Fundamentally, this is because more than one bridge is a list of lists of SpatialLines, rather than just one SpatialLines object.

Maybe I'm making this harder than it is and am missing something on how to combine Spatial lists into one consumable object by leaflet (rbind has not worked for me). I'm trying to make a working reprex so others can check this out as I believe my use case is quite common (user interacts with data table to display records of interest)

In this case I suggest to consider reading the data in via {sf} package instead of whatever are you using now.

sf plays nicely with both databases and leaflet, and returns data as a (modified) data frame. Filtering is very easy.

For a example consider this piece of code. What it does is spins up a local sqlite database and creates in it a table called lines. I did not have the time to create some lines, so I grabbed a piece of code from a somewhat unrelated blog post Lines from Points · Jindra Lacko This part of the reprex is needlessly complicated, but please bear with me :slight_smile:

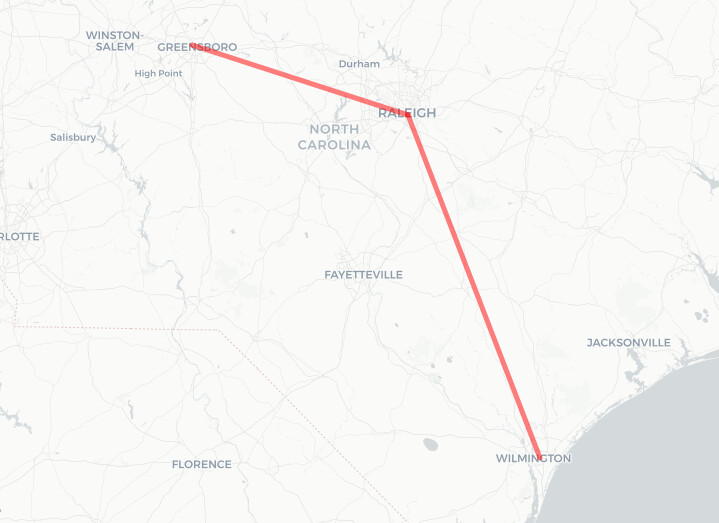
Once the local database is spun up and populated I demonstrate the ease of querying it via SQL and displaying a result consisting of two rows (raleigh 2 wilmington + raleigh 2 greensboro) in a leaflet object.


library(sf)
library(dplyr)
library(DBI) # generic DBI interface
library(RSQLite) # to spin up a local database
library(leaflet)
 
cities <- data.frame(name = c("Raleigh", "Greensboro", "Wilmington"),
                     id = 1:3,
                     x = c(-78.633333, -79.819444, -77.912222),
                     y = c(35.766667, 36.08, 34.223333)) %>% 
  st_as_sf(coords = c("x", "y"), crs = 4326)


# a function to draw lines from points
# see https://www.jla-data.net/eng/lines-from-points/
points_to_lines <- function(data, ids, names, order_matters = TRUE) {
  
  # dataframe of combinations - based on row index
  idx <- expand.grid(start = seq(1, nrow(data), 1),
                     end = seq(1, nrow(data), 1)) %>%
    # no line with start & end being the same point
    dplyr::filter(start != end) %>%  
    # when order doesn't matter just one direction is enough
    dplyr::filter(order_matters | start > end) 
  
  
  # cycle over the combinations
  for (i in seq_along(idx$start)) {
    
    # line object from two points
    wrk_line  <- data[c(idx$start[i], idx$end[i]), ] %>% 
      st_coordinates() %>% 
      st_linestring() %>% 
      st_sfc()
    
    # a single row of results dataframe
    line_data <- data.frame(
      start = pull(data, ids)[idx$start[i]],
      end = pull(data, ids)[idx$end[i]],
      label = paste(pull(data, names)[idx$start[i]], 
                    "-", 
                    pull(data, names)[idx$end[i]]),
      geometry = wrk_line
    )
    
    # bind results rows to a single object
    if (i == 1) {
      res <- line_data
      
    } else {
      res <- dplyr::bind_rows(res, line_data)
      
    } # /if - saving results
    
  } # /for
  
  # finalize function result
  res <- sf::st_as_sf(res, crs = sf::st_crs(data))
  
  res
  
} # /function

old_lines <- points_to_lines(cities, "id", "name")

# spin up a sqlite database 
con <- DBI::dbConnect(RSQLite::SQLite(), "go-tar-heels.sqlite")

# populate the database with some lines data
sf::st_write(old_lines, con, "lines")

# here you can double check the file via a SQL client of your choice
# I suggest dbeaver, but it is not obligatory :)

# now the interesting part!
new_lines <- sf::st_read(dsn = con,
                     query = "select * 
                              from lines
                              where start = 1")
# clean up after yourself
DBI::dbDisconnect(con) 


class(new_lines) # this will be sf data frame


leaflet() %>% 
  addProviderTiles("CartoDB.Positron") %>% 
  addPolylines(data = new_lines,
               color = "red",
               label = ~label)
This topic was automatically closed 21 days after the last reply. New replies are no longer allowed.

If you have a query related to it or one of the replies, start a new topic and refer back with a link.