Authors:
- Richard Iannone - Github - Twitter - LinkedIn
- Curtis Kephart Twitter - LinkedIn
- Based on original work by Mike Jaboo - LinkedIn
View the Repo - PDF/LaTeX Table - HTML Table - Data (xlsx)
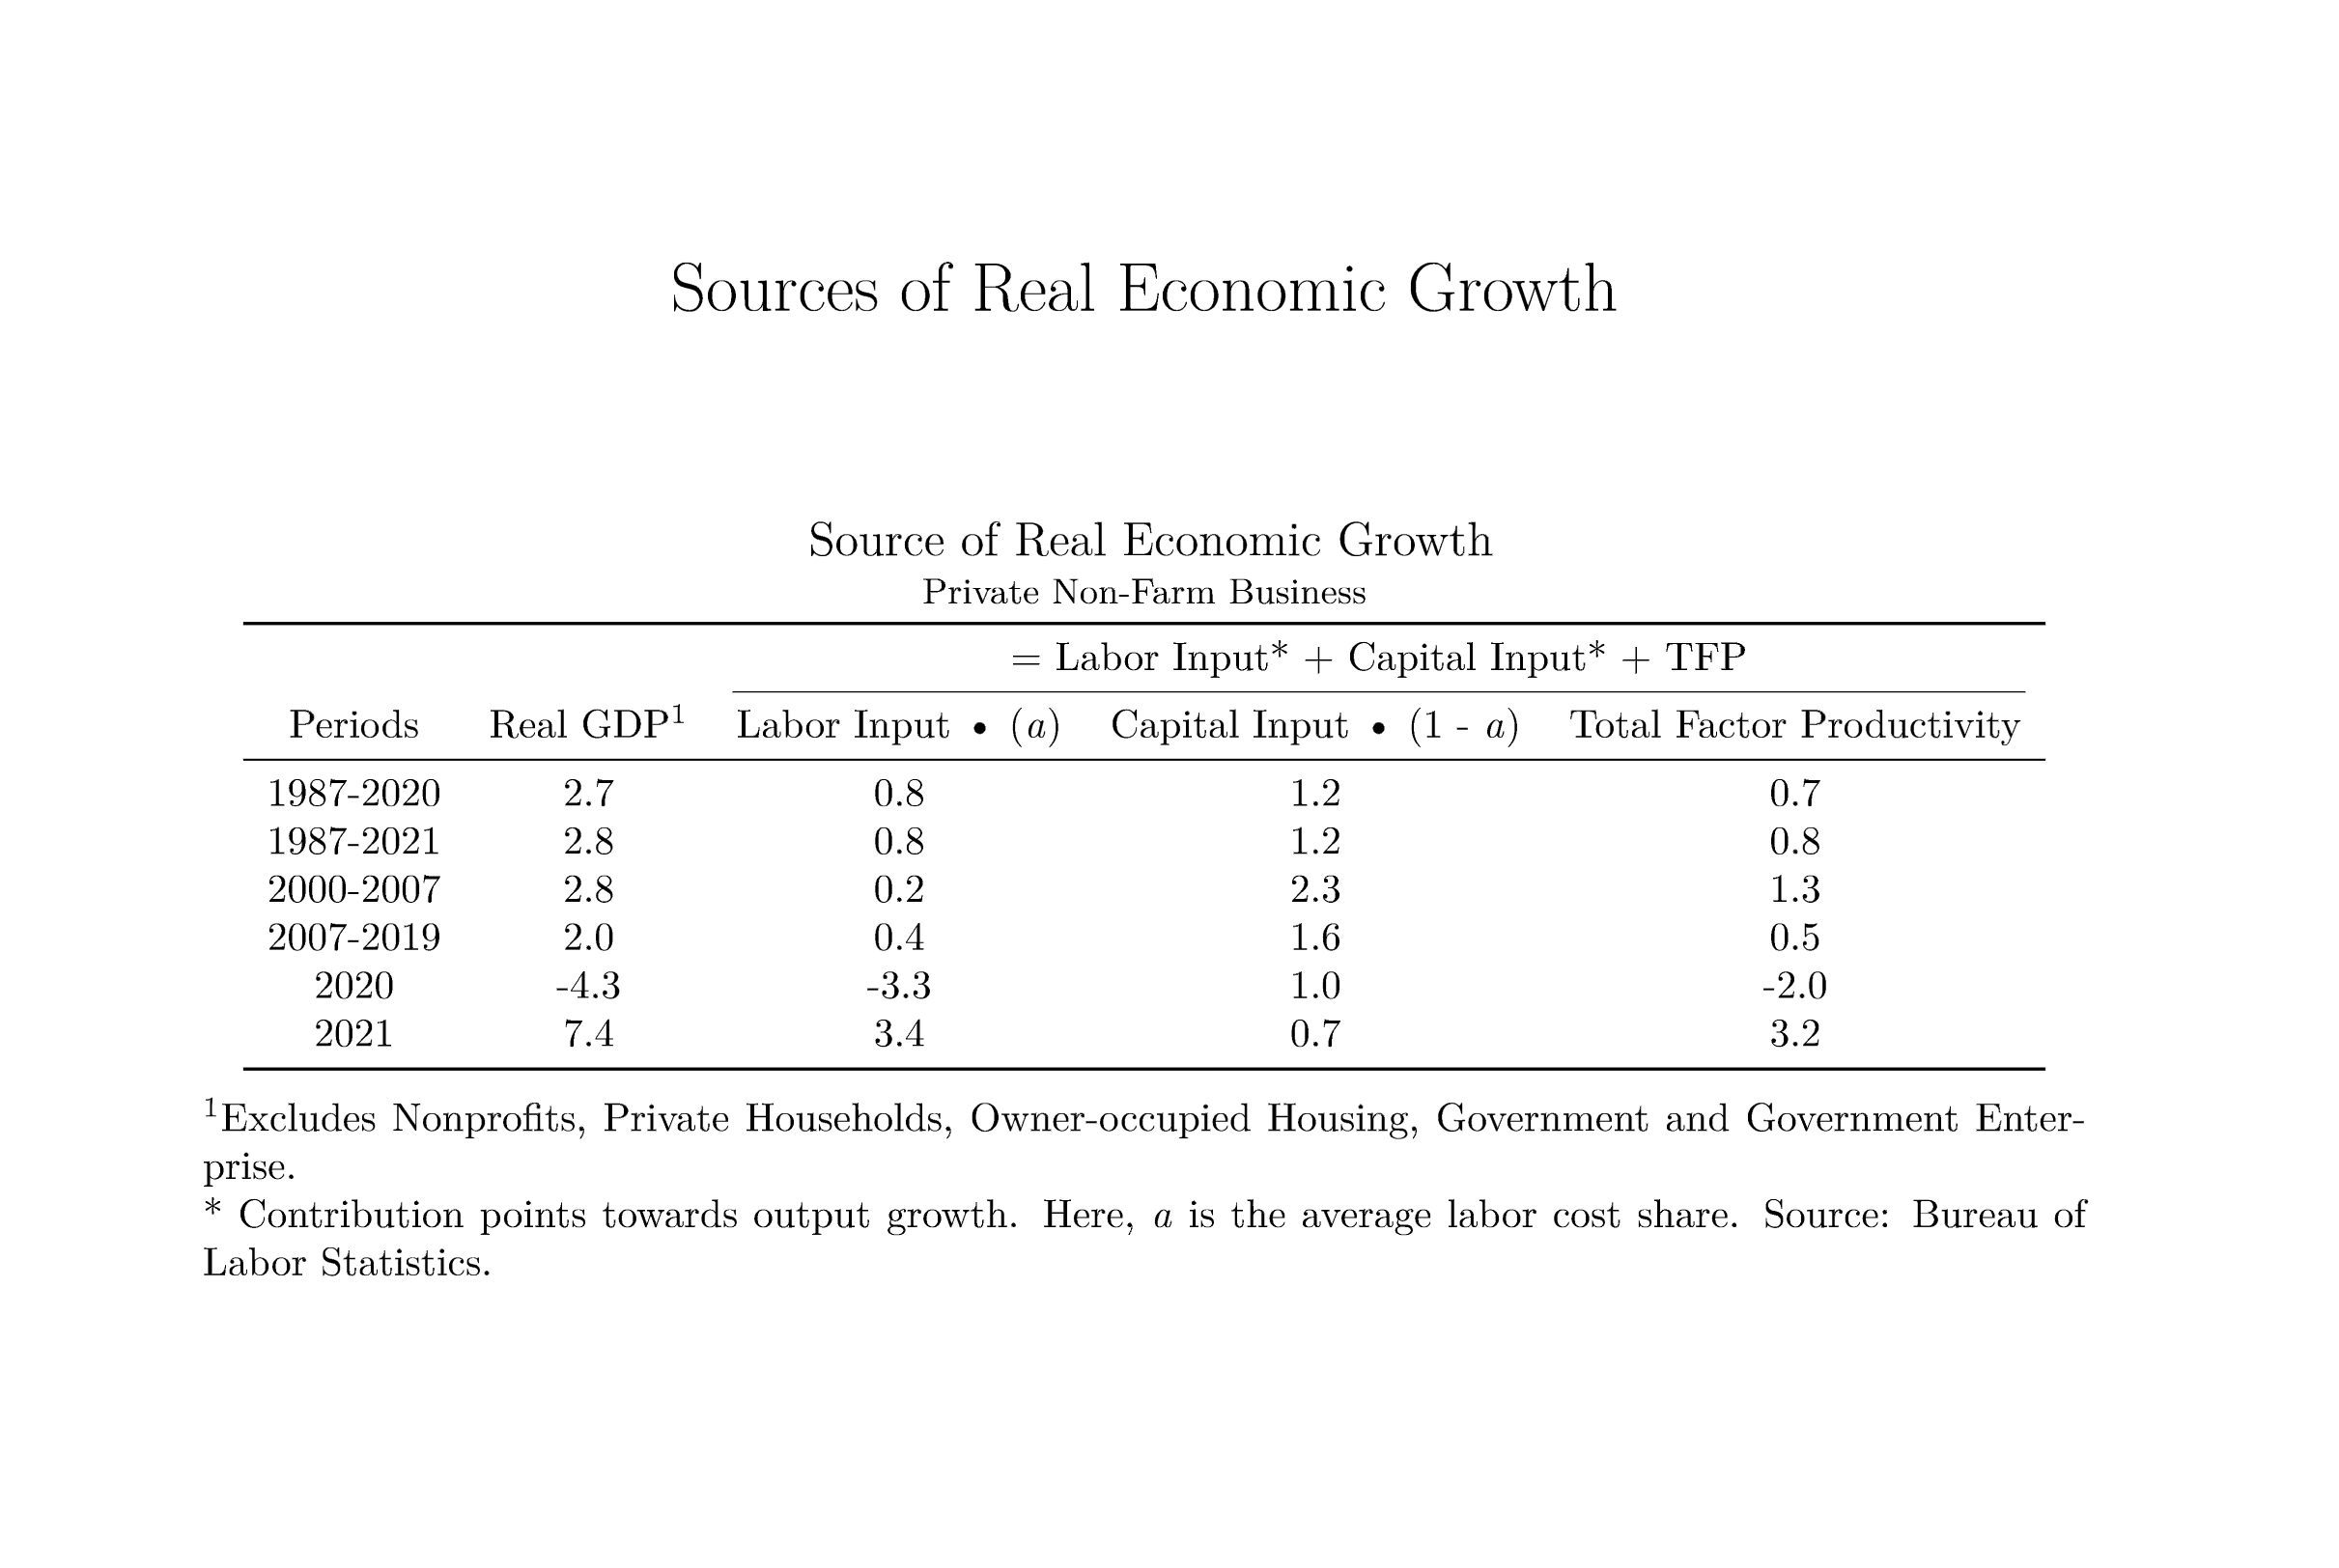
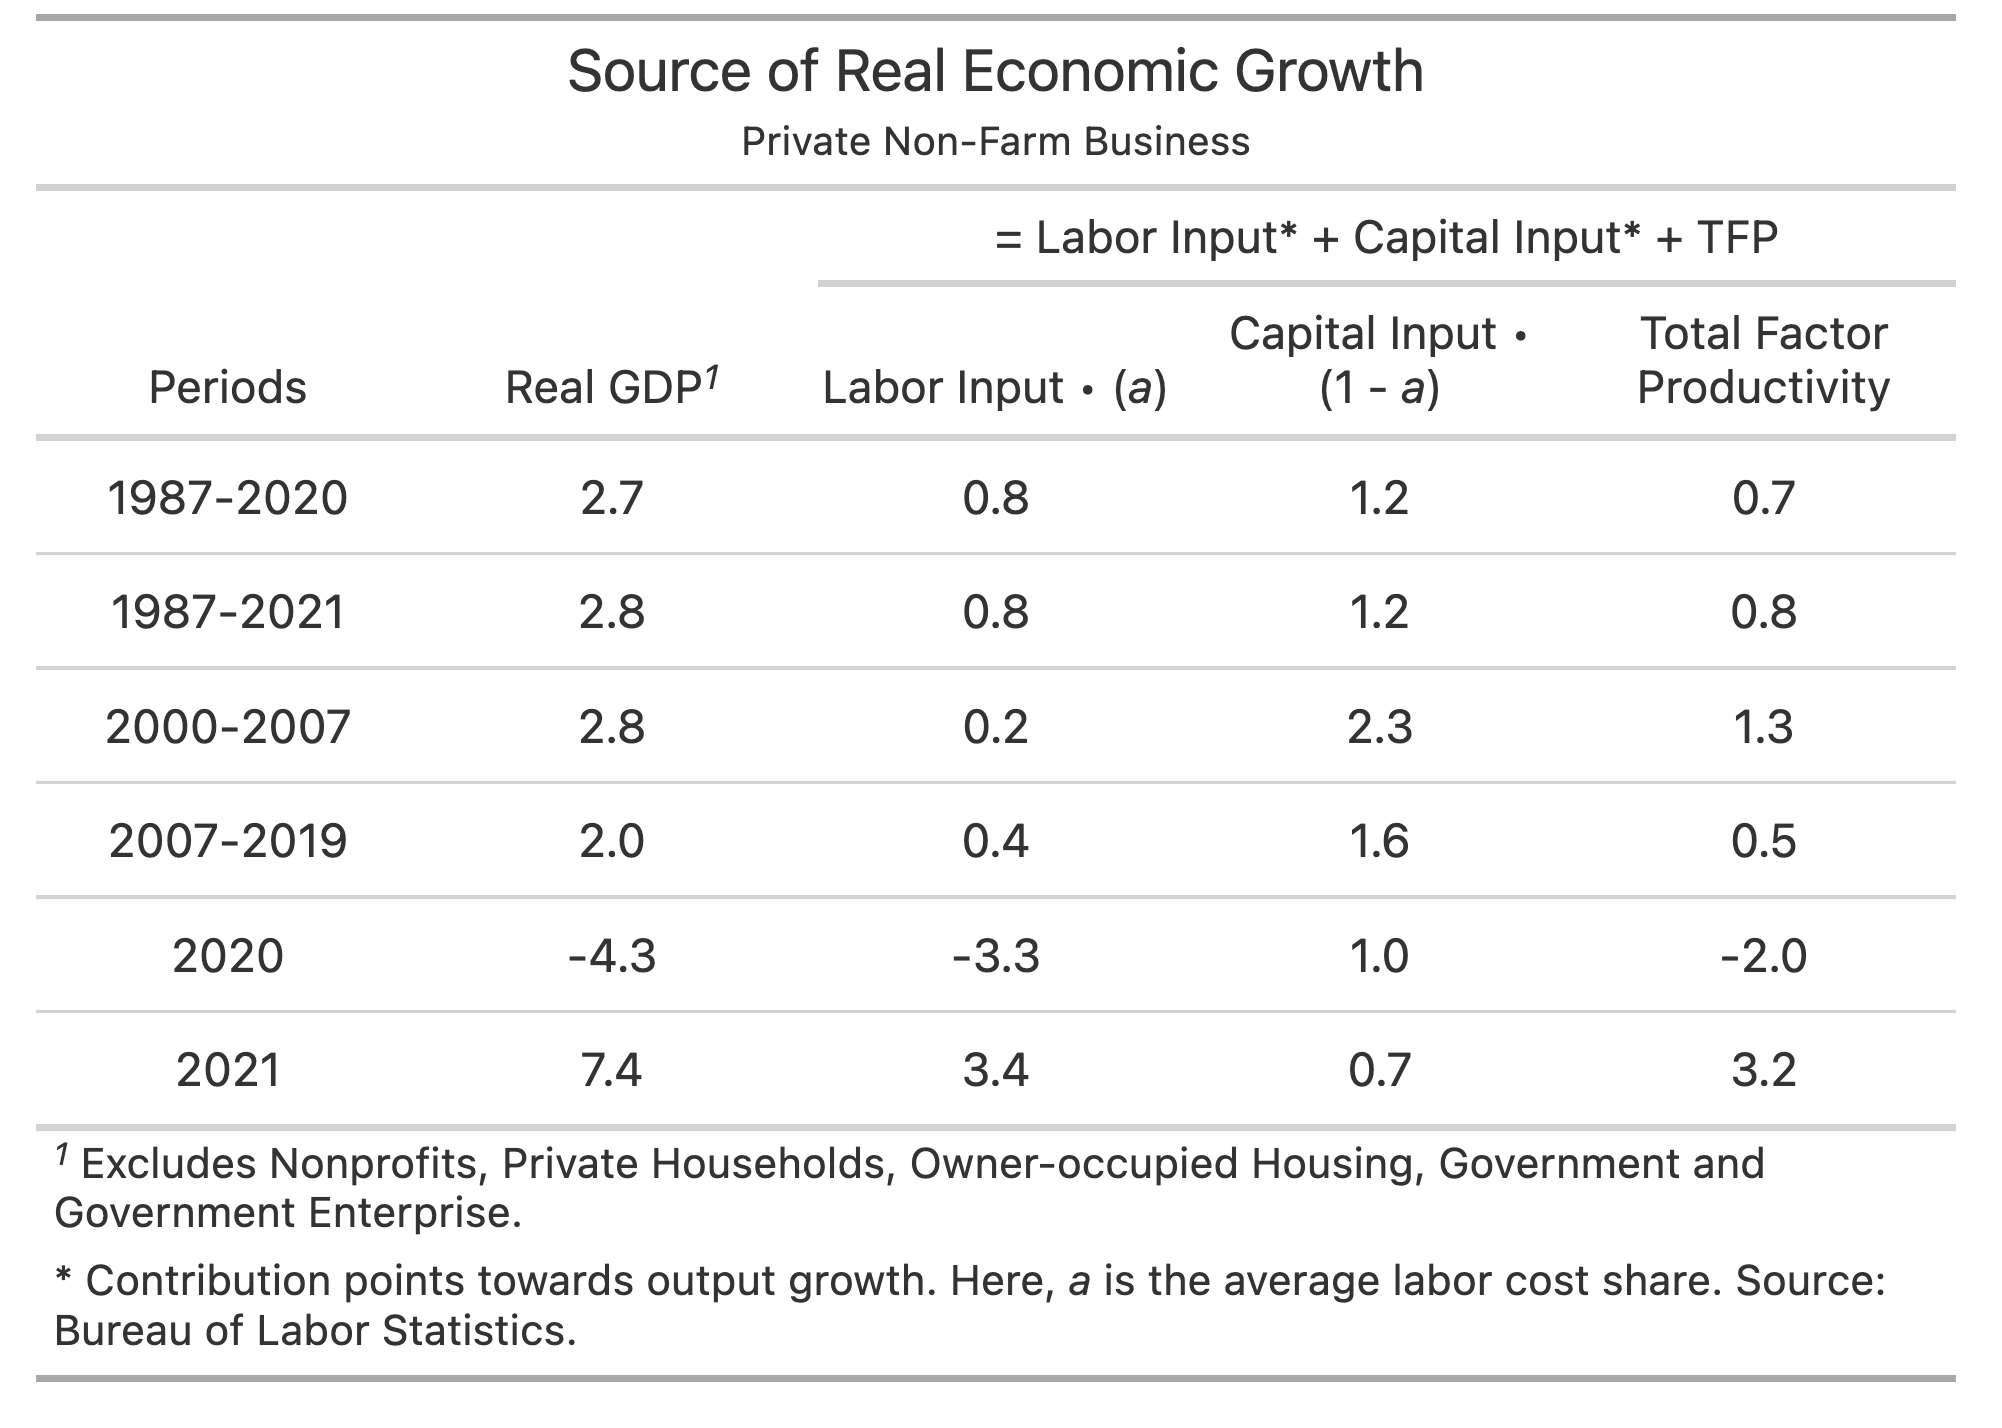
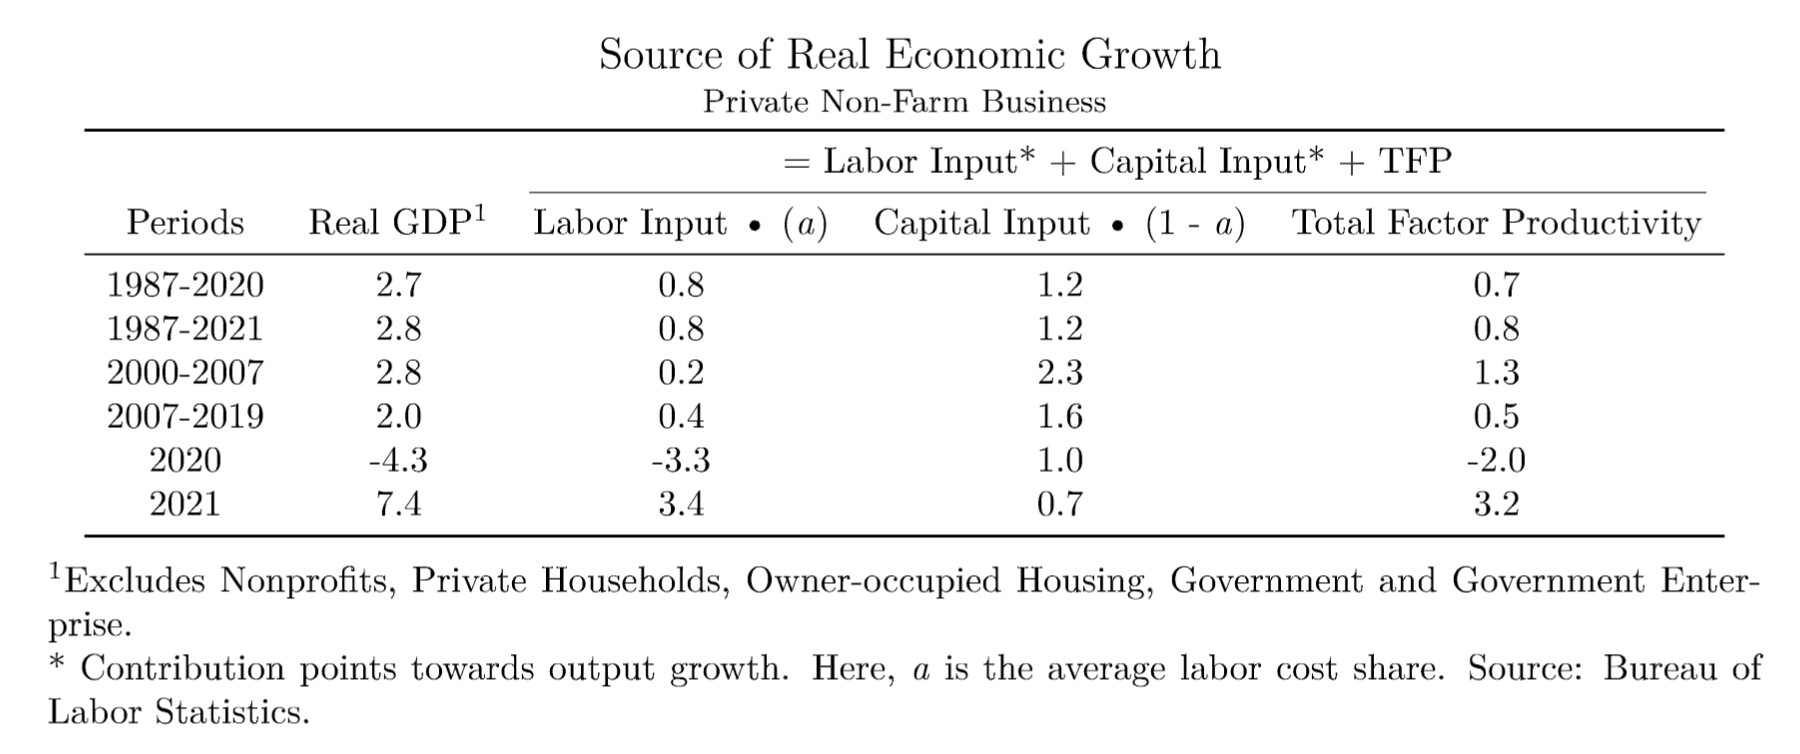
Mike Jadoo, an economic enthusiast, shared on LinkedIn a table summarizing the sources of real economic growth and Total Factor Productivity. We are often called to produce and distribute these kinds of simple data tables, sharing with audiences who may require different output format.
This is a nice opportunity to demonstrate how to use gt to create and customize these kinds of tables, produce output in HTML, PDF, for LaTeX, and discuss the process along the way.
Create the table
gt_tbl <-

  # Load Data, see repo for original data.
  tibble::tribble(
       ~Years, ~Output, ~TFP, ~CombineInputs, ~Capital, ~Labor,     ~LaborS,   ~CapitalS, ~LaborC, ~CapitalC,
  "1987-2020",     2.7,  0.7,              2,      3.5,    1.2, 0.649323529, 0.350676471,     0.8,       1.2,
  "1987-2021",     2.8,  0.8,              2,      3.5,    1.3, 0.648971429, 0.351028571,     0.8,       1.2,
  "2000-2007",     2.8,  1.3,            1.5,      3.5,    0.5, 0.344857143, 0.655142857,     0.2,       2.3,
  "2007-2019",       2,  0.5,            1.5,      2.5,      1, 0.378076923, 0.621923077,     0.4,       1.6,
       "2020",    -4.3,   -2,           -2.4,      2.7,   -5.3,       0.627,       0.373,    -3.3,         1,
       "2021",     7.4,  3.2,            4.1,        2,    5.3,       0.637,       0.363,     3.4,       0.7
  ) %>%

  # Create gt table
  dplyr::select(Years, Output, LaborC, CapitalC, TFP) %>%
  gt() %>%

  #center align columns
  cols_align(align = c("center"), columns = everything()) %>%

  # Add column labels
  cols_label(
    Years = "Periods",
    Output = "Real GDP",
    LaborC = md("Labor Input • (*a*)"),
    CapitalC = md("Capital Input • (1 - *a*)"),
    TFP = "Total Factor Productivity"
  ) %>%

  # resize Capital Input column
  cols_width(CapitalC ~ pct(20)) %>%

  # resize font size.
  tab_options(
    table.width = pct(80),
    table.font.size = "smaller",
    column_labels.font.size = "small"
  ) %>%

  # Add table title and subtitle
  tab_header(
    title = "Source of Real Economic Growth",
    subtitle = "Private Non-Farm Business"
  ) %>%

  # Add and title a column label spanner
  tab_spanner(
    label = html("= Labor Input* + Capital Input* + TFP"),
    columns = matches("LaborC|CapitalC|TFP")
  ) %>%

  # Add and format footnotes
  # Note the md() function to handle markdown, will convert this to HTML,
  # LaTeX or other, defined by yaml output parameter.
  tab_source_note(md("\\* Contribution points towards output growth.")) %>%
  tab_source_note(md("Here, *a* is the average labor cost share.")) %>%
  tab_source_note(md("Source: Bureau of Labor Statistics.")) %>%
  tab_footnote(
    footnote = "Excludes Nonprofits, Private Households, Owner-occupied Housing,
    Government and Government Enterprise.",
    locations = cells_column_labels(columns = Output)
  ) %>%
  tab_options(source_notes.multiline = FALSE)

gt_tbl
HTML Output
A GIF showing the development - HTML
Each frame is a step in the gt outlined above.
LaTeX PDF Output
A GIF showing the development - PDF
Each frame is a step in the gt outlined above.
Data Source
This is adapted from a LinkedIn Post.
Total factor productivity trends, 2021
In 2021 we saw a sharp return to Real GDP growth with an incredible 7.4%. Real output growth was contributed by a sharp increase in the contribution of labor (3.4 contributions points) and total factor productivity growth (3.2%).
Private nonfarm business sector total factor productivity increased to 3.2% the largest increase since 1983 and resulted from strong output growth of 7.4%, outpacing the growth of combined inputs of capital and labor inputs growth of 4.1%.
In 2020, the economic downturn caused by the COVID-19 pandemic saw a sharp decrease in economic growth at -4.3% was caused primarily by a decrease in labor input (number of hours worked by all persons adjusted by their labor composition) at -3.3 contribution points and multifactor productivity growth of -2.0.
To learn more: https://www.bls.gov/news.release/prod3.nr0.htm
Created using gt package in R.
link to code: https://github.com/EconMike/TFP2021GTpackage