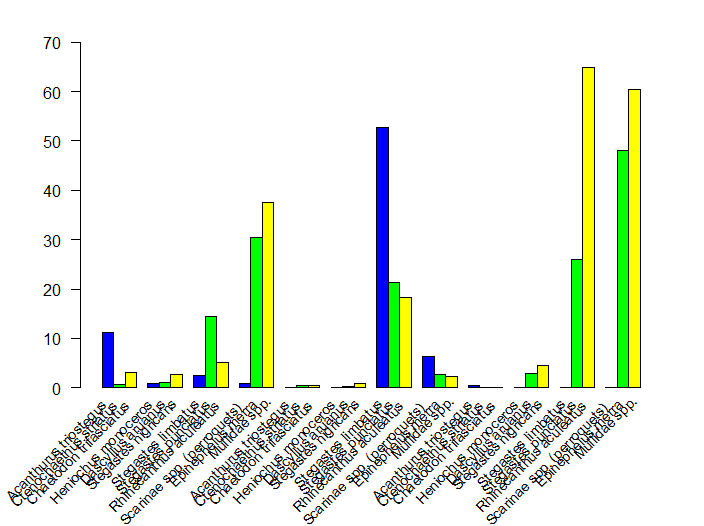
Hi. I had to do a barplot of the mean abundance of 12 differents species at 3 differents sites. I managed to obtain a single barplot with a colour corresponding for each site. However, when i had to name the labels, the species labels are changing even though the specie is the same.
On the picture i posted, each group of 3 bar should correspond to a single specie but i stuck on how to code it.
DAR_p <- DAR$abondance[,1]
PLM_p <- PLM$abondance[,1]
PLI_p <- PLI$abondance[,1]
combine <- rbind(DAR_p, PLI_p, PLM_p)
names <- unique(data$espece)
bar <- barplot(combine, beside = T, ylim = c(0,70), col = c("blue","green",
"yellow"))
names <- unique(data$espece)
text(bar, par("usr")[3], labels = names, srt = 45, adj = c(1.1,1.1), xpd = TRUE, cex=.9)