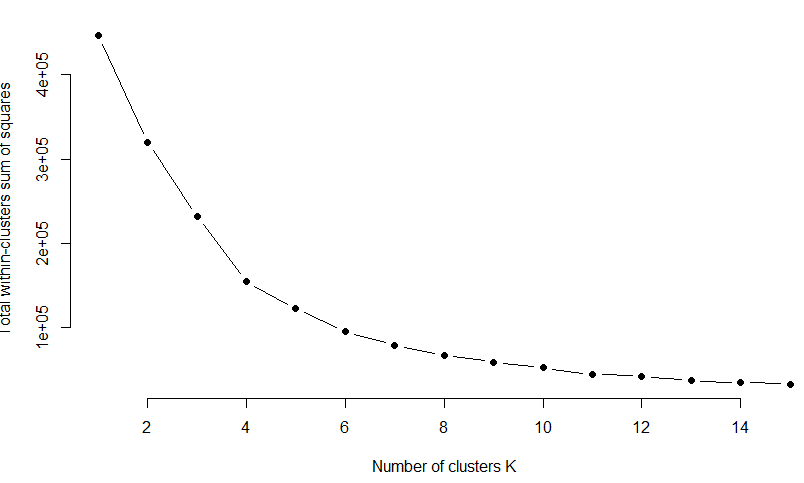
Hi. I'm very new to Rstudio, so apologies if my questions are not very clear. I'm trying to conduct a k-means cluster analysis in Rstudio on GPS coordinates. I want to cluster the locations based on their GPS-coordinates, so the locations that are close to each other are clustered together. First, I'm trying to use the elbow method to determine the number of clusters using the below code.
> GPS <- read.delim(file.choose())
> GPS <- na.omit(GPS)
scaled_data = as.matrix(scale(GPSClean))
set.seed(123)
> k.max <- 15
> data <- scaled_data
> wss <- sapply(1:k.max,
               function(k){kmeans(data, k, nstart=50,iter.max = 15 )$tot.withinss})
> wss
> plot(1:k.max, wss,
+      type="b", pch = 19, frame = FALSE,
+      xlab="Number of clusters K",
+      ylab="Total within-clusters sum of squares")
I managed to get this output, however, I am not sure if this shows the right thing. Is there any way to see how Rstudio interpreted the data, and if this is actually based on the X- and Y-coordinates? If it's correct, it looks like there should be four clusters, but I'm afraid to make the wrong conclusion if R didn't interpret the data right.
