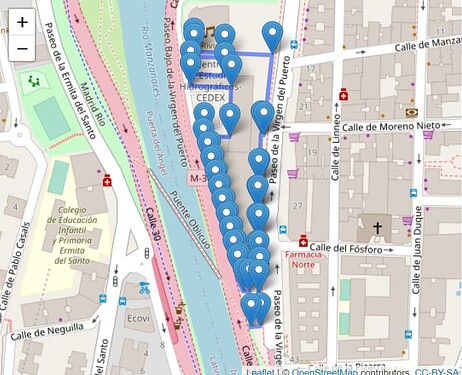
I have this dataframe with a series of points and convert it to the appropriate crs and epsg.
ups <- data.frame(
         x = c(438715.04,438798.91,438788.73,438786.12,
                 438783.66,438782.75,438781.04,438782.06,438781.14,
                 438782.39,438780.78,438782.26,438781.44,438782.69,438782.36,
                 438783.89,438773.87,438772.01,438765.75,438759.05,438761.33,
                 438755.3,438757.47,438751.55,438753.84,438747.58,438749.98,
                 438743.72,438746,438739.74,438742.26,438736.11,438738.51,
                 438732.25,438734.65,438728.39,438730.9,438724.3,438725.12,
                 438752.3,438754.78,438710.65,438711.31,438747.49,
                 438747.98,438714.77),
           y = c(4473822.89,4473818.29,4473733.53,
                 4473733.67,4473683.36,4473683.37,4473655.16,4473654.92,4473625.57,
                 4473625.33,4473596.1,4473596.09,4473578.98,4473578.86,
                 4473565.82,4473530.22,4473529.51,4473566.59,4473567.09,
                 4473582.11,4473583.34,4473597.1,4473598.22,4473612.21,
                 4473613.21,4473626.87,4473628.21,4473641.97,4473642.97,4473656.74,
                 4473658.08,4473671.96,4473673.19,4473686.84,4473687.95,
                 4473701.83,4473703.06,4473716.83,4473733.03,4473731.79,
                 4473784.03,4473786.43,4473798.66,4473796.78,4473815.71,
                 4473817.45)
) %>%
        st_as_sf(coords=c("x", "y"), crs=32630) %>%
        st_transform(4326)
To map it, I use
ups %>%
        leaflet() %>%
        addTiles() %>%
        addMarkers()
Now I want to do three things:
-
- Connect the dots with a line.
-
- Create a polygon
-
- Export it as a shapefile
Some clue?
