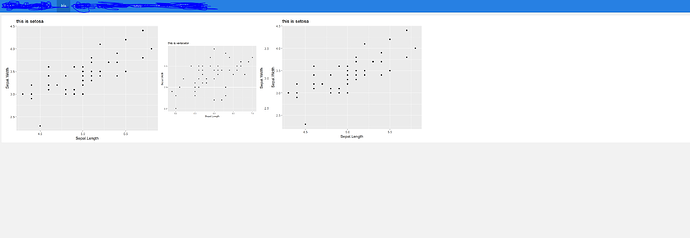
Hi
I have a number of groups I am using the map function to output a number of graphs. Ideally I would like these to be available in a flex dashboard where it would be a scrollable page of the graphs that are printed, rather than me manually adding rows/columns. Currently when I do this they seem to print on top of eachother. My yaml header and reprex below
---
title: "XXXXXXXXX data"
output:
  flexdashboard::flex_dashboard:
    vertical_layout: scroll
editor_options:
  chunk_output_type: console


---

```{r setup, include=FALSE}

library(tidyverse)
library(flexdashboard)

```
# Iris

```{r}
my_data <- iris %>%
  mutate(title = paste("this is", Species)) %>%
  group_by(title) %>%
  nest()
```


```{r}
my_graphs <- my_data %>%
  mutate(graphs = map2(
    data, title, ~
    ggplot(.x, aes(Sepal.Length, Sepal.Width)) +
      geom_point() +
      ggtitle(.y)
  ))
```


```{r}
my_graphs$graphs %>% map(print)
```
