Issues with stacked bar plot

Hi, I am new using R and stacked bar plots. I want to create a new categorical feature of adults for females and males combined and stack it with the infants to see the adult/infant proportion as a function of the ring number.

Here is the code I did.

library(tidyverse)

#Code to create a bar plot.
abalone <- read_csv("abalone.csv")

#Q3
#Library used
library(tidyverse)

barplot <- abalone %>%
group_by(Sex, Rings) %>%
mutate(adult = (Sex != 'I'))%>%
summarize(adult = mean(adult)) %>%
count(Rings) %>%
ggplot(abalone, mapping = aes(x= as.factor(Rings), fill= Sex)) +
geom_bar(position = "stack")

barplot

image

This plot is wrong.

dput(head(abalone,9))
structure(list(Sex = c("M", "M", "F", "M", "I", "I", "F", "F",
"M"), Length = c(0.455, 0.35, 0.53, 0.44, 0.33, 0.425, 0.53,
0.545, 0.475), Diameter = c(0.365, 0.265, 0.42, 0.365, 0.255,
0.3, 0.415, 0.425, 0.37), Height = c(0.095, 0.09, 0.135, 0.125,
0.08, 0.095, 0.15, 0.125, 0.125), WholeWeight = c(0.514, 0.2255,
0.677, 0.516, 0.205, 0.3515, 0.7775, 0.768, 0.5095), ShuckedWeight = c(0.2245,
0.0995, 0.2565, 0.2155, 0.0895, 0.141, 0.237, 0.294, 0.2165),
VisceraWeight = c(0.101, 0.0485, 0.1415, 0.114, 0.0395, 0.0775,
0.1415, 0.1495, 0.1125), ShellWeight = c(0.15, 0.07, 0.21,
0.155, 0.055, 0.12, 0.33, 0.26, 0.165), Rings = c(15, 7,
9, 10, 7, 8, 20, 16, 9)), class = c("tbl_df", "tbl", "data.frame"
), row.names = c(NA, -9L))

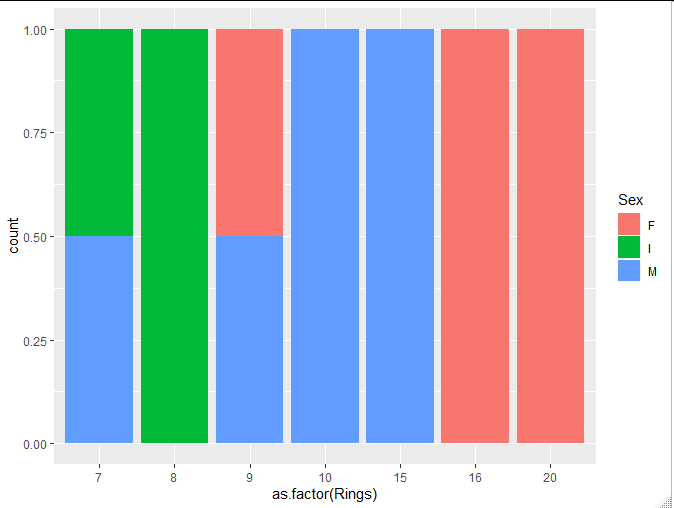
Thanks for creating an Reproducible example and sharing the data. However to me it's not completely clear, what you actually want to do, want to count. Also in the provided data there is just a single occurrence per ring.
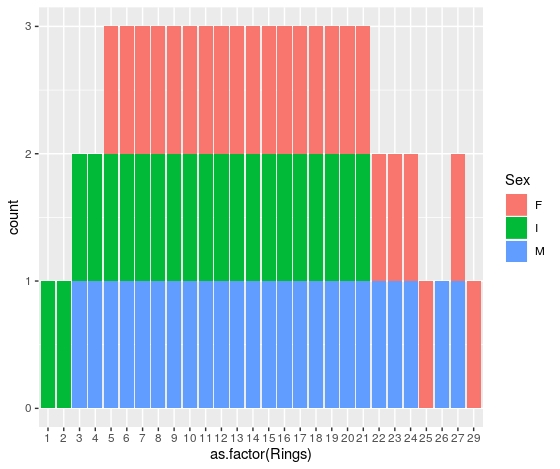
So I guess you just want to count the occurrences per Ring and Sex?

This can also be achieved this way:

abalone_counted = abalone %>%
   group_by(Rings, Sex) %>%
   summarize(counts = n())

And the plot then with:

ggplot(abalone_counted, aes(x= as.factor(Rings), fill= Sex)) +
   geom_bar(position = "fill")

Does this help?

Hi Matthias,

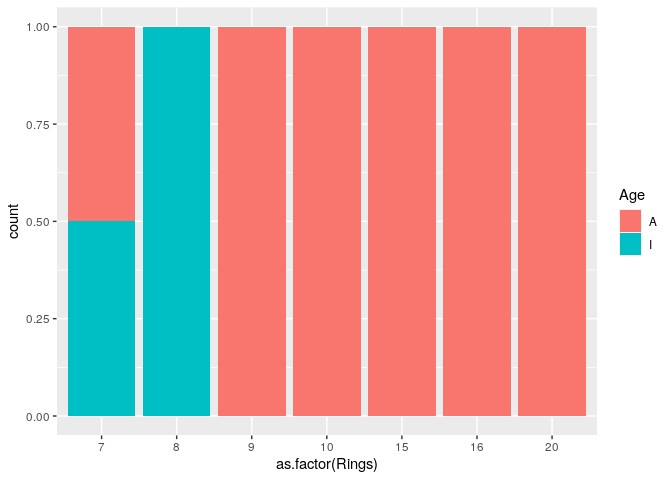
Thank you for your feedback and the plot looks better! I am trying to create a variable that includes Females and Males adults but not infants so in this way there will be only two variables (two colors) on the stacked barplot.

I hope this makes more sense now.

and for the two variables I meant adults and infants

This is what I understand from your request

library(tidyverse)

# Sample data on a copy/paste friendly format
abalone <- data.frame(
  stringsAsFactors = FALSE,
               Sex = c("M", "M", "F", "M", "I", "I", "F", "F", "M"),
            Length = c(0.455, 0.35, 0.53, 0.44, 0.33, 0.425, 0.53, 0.545, 0.475),
          Diameter = c(0.365,0.265,0.42,0.365,
                       0.255,0.3,0.415,0.425,0.37),
            Height = c(0.095,0.09,0.135,0.125,0.08,
                       0.095,0.15,0.125,0.125),
       WholeWeight = c(0.514,0.2255,0.677,0.516,
                       0.205,0.3515,0.7775,0.768,0.5095),
     ShuckedWeight = c(0.2245,0.0995,0.2565,0.2155,
                       0.0895,0.141,0.237,0.294,0.2165),
     VisceraWeight = c(0.101,0.0485,0.1415,0.114,
                       0.0395,0.0775,0.1415,0.1495,0.1125),
       ShellWeight = c(0.15, 0.07, 0.21, 0.155, 0.055, 0.12, 0.33, 0.26, 0.165),
             Rings = c(15, 7, 9, 10, 7, 8, 20, 16, 9)
)

abalone %>%
    mutate(Age = if_else(Sex == "M" | Sex == "F", "A", Sex)) %>% 
    count(Rings, Age) %>% 
    ggplot(aes(x= as.factor(Rings), fill= Age)) +
    geom_bar(position = "fill")

Also, I would like to strongly suggest you read this free ebook so you can solve your homework yourself more easily and actually learn R in the process.

This topic was automatically closed 21 days after the last reply. New replies are no longer allowed.