Hello, I am working on an R Shiny project to visualize the spread of COVID19 around the world. When I run the app locally, it works just fine, but when I try to deploy the app, it runs into issues which I am assuming are related to storing the shapefiles: I get an error on the map page that reads, "An error has occurred. Check your logs or contact the app author for clarification."
Here is my code so far:
#Read in datasets
who_data <- read.csv("https://covid19.who.int/WHO-COVID-19-global-data.csv")
pops <- read.csv("https://gist.githubusercontent.com/curran/0ac4077c7fc6390f5dd33bf5c06cb5ff/raw/605c54080c7a93a417a3cea93fd52e7550e76500/UN_Population_2019.csv")


#download.file("http://thematicmapping.org/downloads/TM_WORLD_BORDERS_SIMPL-0.3.zip", destfile="world_shape_file.zip")
#unzip("world_shape_file.zip")
#world_spdf=readOGR(dsn = getwd(),layer = "TM_WORLD_BORDERS_SIMPL-0.3")


#-----Preprocessing Data-----#

who_data$Date <- as.Date(who_data$Date_reported)

cols=colnames(pops)
pop_data=pops[,c(cols[1],cols[length(cols)])]
colnames(pop_data)=c("Country","Population")
pop_data$Population=pop_data$Population*1000

covid19_data=merge(x=who_data,y=pop_data,by="Country",all.x=TRUE)


covid19_data$Date_reported=NULL
covid19_data$Country_code=NULL
covid19_data <- covid19_data[order(covid19_data$Country,covid19_data$Date),]
covid19_data=covid19_data[c(1,2,7,8,3,4,5,6)]


#----- Load libraries -----#
library(shiny)
library(shinydashboard)
library(DT)
library(ggplot2)
library(rsconnect)
library(packrat)
library(formattable)
library(leaflet)
library(leaflet.extras)
library(rgdal)
library(sp)
library(raster)
library(RColorBrewer)
library(scales)
library(lattice)
library(dplyr)
library(reshape2)
library(plotly)


# Define UI for application


ui <- fluidPage(
    dashboardPage(
        dashboardHeader(title="COVID19 Analysis"),
        dashboardSidebar(
            sidebarMenu(

                menuItem("Spread of the Virus",
                         tabName="map_spread",
                         icon=icon("viruses")
                ))
        ),
        dashboardBody(
            tabItems(

                tabItem(
                    tabName = "map_spread",
                    sliderInput("date_filter", "Date Filter",
                                min = min(covid19_data$Date), max = max(covid19_data$Date), value = min(covid19_data$Date)
                    ),
                    p("Not ready --> need to clean up data"),
                    leafletOutput("world_map")

                )))))

# Define server logic
server <- function(input, output) {


    #---------- WORLD MAP ----------#


    map_filter=reactive({
        filter=subset(covid19_data,Date==input$date_filter)
        return(filter)
    })


    merge_filter=reactive({
        names(world_spdf)[names(world_spdf) == "NAME"] <- "Country"
        map_data=merge(x=world_spdf,y=map_filter(),by="Country",all.x=TRUE)
    })


    #Choropleth Map
    output$world_map=renderLeaflet({
        bins=c(0,100,500,1000,5000,10000,Inf)
        pal=colorBin(palette = "YlOrBr",domain = merge_filter()$Cumulative_cases,
                     na.color = "transparent",
                     bins=bins)
        customLabel = paste("Country: ",merge_filter()$Country,"<br/>",
                            "Cumulative cases: ",merge_filter()$Cumulative_cases, serp="") %>%
            lapply(htmltools::HTML)

        leaflet(merge_filter()) %>%
            addProviderTiles(providers$OpenStreetMap,options=tileOptions(minZoom = 2,
                                                                         maxZoom = 8)) %>%
            addPolygons(fillColor = ~pal(Cumulative_cases),
                        fillOpacity = 0.9,
                        stroke = TRUE,
                        color = "white",
                        highlight=highlightOptions(
                            weight=5,
                            fillOpacity = 0.3
                        ),
                        label=customLabel,
                        weight=0.3,
                        smoothFactor = 0.2) %>%

            addLegend(
                pal=pal,
                values = ~Cumulative_cases,
                position = "bottomright",
                title = "Cumulative cases"
            )
    })


}

# Run the application
shinyApp(ui = ui, server = server)
When I try to deploy the app with the three lines uncommented:
download.file("http://thematicmapping.org/downloads/TM_WORLD_BORDERS_SIMPL-0.3.zip", destfile="world_shape_file.zip")
unzip("world_shape_file.zip")
world_spdf=readOGR(dsn = getwd(),layer = "TM_WORLD_BORDERS_SIMPL-0.3")
I will get an error in the browser that reads, " An error has occurred
The application failed to start (exited with code 1).
trying URL 'http://thematicmapping.org/downloads/TM_WORLD_BORDERS_SIMPL-0.3.zip'
Content type 'application/zip' length 230647 bytes (225 KB)
==================================================
downloaded 225 KB


Error in value[[3L]](cond) : could not find function "readOGR"
Calls: local ... tryCatch -> tryCatchList -> tryCatchOne -> <Anonymous>
Execution halted"
If I try to deploy the app with those 3 lines commented out, the app will load, but in place of the map there will be an error that reads,
An error has occurred. Check your logs or contact the app author for clarification.
Usually when I've come across this error, I've found that I have saved something locally, but not on the server or forgot to load a library. I understand external data files need to be saved in the same folder as the app.R file and images/maps need to be saved in a folder titled www. I have created this www folder in the same directory as the app.R file, but still haven't been able to fix the issues.
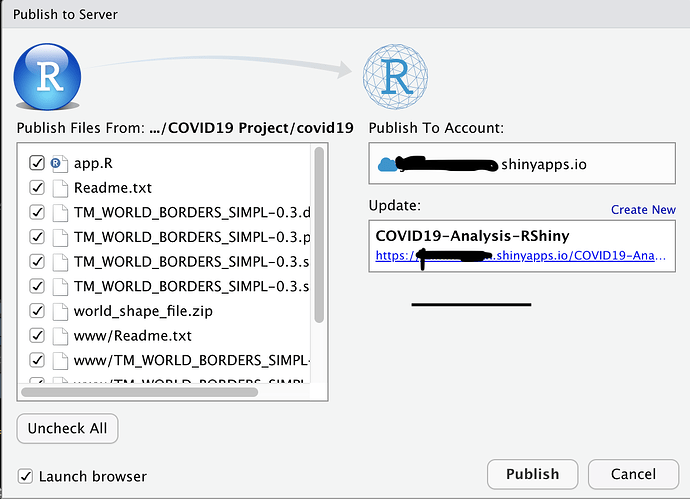
When I try to deploy the app, a window pops up asking me which files I would like to include and I get the attached image.
Should I not be selecting everything or a subset of this? I am really lost and don't know how to proceed on this issue. How can I get my app to deploy successfully and show the choropleth map? I would appreciate any help or guidance on this. Thank you so much!
