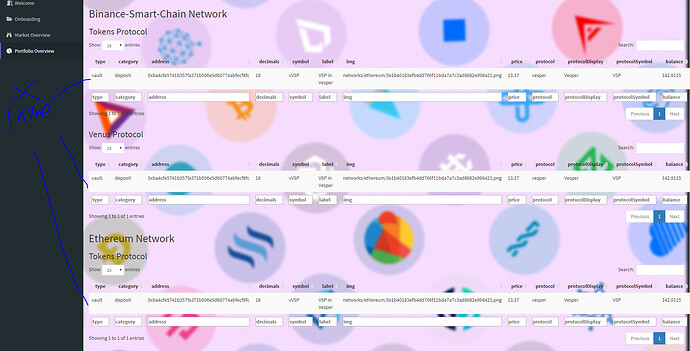
Currently, i am trying to output multiple tables i managed to retrieve with an api call onto a dashboard page with a single uiOutput(). took some reference from this site
however, while i was succesful in putting it into a list for the overall layout and output it into uioutput(), i was not able to acheive the desired results as all the tables were the same, in reality it should be different as i have already tagged a unique dataframe to each renderdatatable()
below shows the screen shot and the code. would appreciate some help here thank you!
UPDATE: RUNNABLE CODE BELOW FOR YOU TO RUN
library(httr)
library(jsonlite)
library(plyr)
library(data.table)
library(rlist)
library(shiny)
###########  UI   ############
ui <- fluidPage(uiOutput('datatables'))


#########  SERVER  ###########3
server <- function(input, output, session){
  output$datatables <- renderUI({
    link <- 'https://api.zapper.fi/v1/protocols/balances/supported?addresses%5B%5D=0x58bbae0159117a75225e72d941dbe35ffd99f894&api_key=96e0cc51-a62e-42ca-acee-910ea7d2a241'

    test <- GET(link)
    test <- fromJSON(rawToChar(test$content))

    counter1 <- 0
    out <- list()
    df <- list()
    for (i in seq(from = 1, to = length(test$network))){
      network <- test$network[i]
      #counter <- counter + 1
      out <- list(out, h2(paste0(str_to_title(network),' Network')))
      for (e in ldply(test$protocols[i], data.frame)$protocol){
        link1 <- paste0(paste0('https://api.zapper.fi/v1/protocols/',e),paste0(paste0('/balances?addresses%5B%5D=0x58bbae0159117a75225e72d941dbe35ffd99f894&network=',network),'&api_key=96e0cc51-a62e-42ca-acee-910ea7d2a241'))
        data <- fromJSON(rawToChar(GET(link1)$content))
        wallet <- '0x58bbae0159117a75225e72d941dbe35ffd99f894'
        #info <- ldply(eval(parse(text=sprintf("data$'%s'$products$assets",wallet))),data.frame)
        out <- list(out, h3(paste0(str_to_title(e),' Protocol')))
        counter1 <- counter1 + 1
        df[[counter1]] <- ldply(eval(parse(text=sprintf("data$'%s'$products$assets",wallet))),data.frame)
        out<- list(out, renderDataTable(df[[counter1]]))
}
}
return(out)
})
}
shinyApp(ui, server)
