Hi
I'm working on a ggplot code where I want to use facet_grid to add facetting based on the "year" variable, but I only want the facet grid to affect the x-axis labeling and not divide the plot itself. I've tried various approaches, but the plot ends up broken, especially the geom_line elements.
Here's my current code:
library(ggplot2)
# Create dummy data of time series
set.seed(123)
data <- data.frame(
  date = seq(as.Date("1998-01-01"), as.Date("2007-12-31"), by = "month"),
  value = rnorm(12, 50, 10)
)
# Convert date to year and month
data$year <- format(data$date, "%Y")
data$month <- format(data$date, "%b")
# Create plot
ggplot(data, aes(x = date, y = value)) +
  geom_line()+
  theme_bw()+
  facet_wrap( ~ year, strip.position = "bottom", scales = "free_x", nrow = 1) +
  theme(panel.spacing.x = unit(0, "lines"),
        strip.background = element_blank(),
        strip.placement = "outside",
        panel.background = element_blank())
It produces the plot :
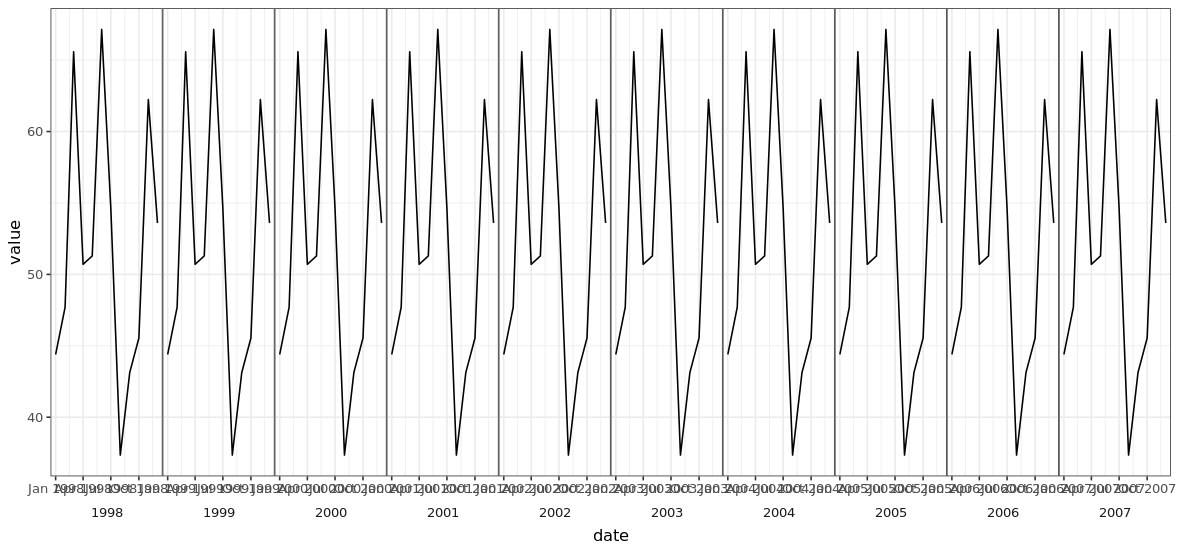
What I am expecting in x-axis labelling ..

Any assistance or suggestions on modifying the code to achieve the desired x-axis labelling with yearly boxes/panels and monthly tick marks [attached expected image] would be greatly appreciated.
Thank you!