Hi all,
I'm having some issues with my time series data.
In my excel, my date format is as follows (17/6/10), by dd/m/yy.
When I import my excel into R, its all fine, but when I transform the data into a time series, and when I check the cycle of the data, it seems to be wrong.
The codes that I used are as follow:
data=read.csv(file='ts3.csv',header = TRUE)
as.Date(data$Date)
gross<- data$Gross
datats<-ts(gross,start = c(17,6,10),frequency = 7)
View(data)
plot.ts(datats,main='Weekly gross of Toy Story 3',xlab='Day in terms of weeks', ylab='Gross')
abline(reg =lm(datats~time(datats)))
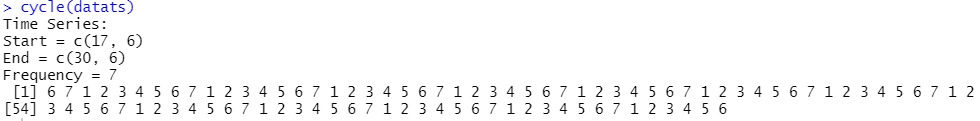
cycle(datats)
Where did I go wrong? is it the start=c() part, or the frequency? My dates are in daily data, for 90+ days, so should my freq=365?
In here, we can see that the start of the cycle is '6', where 17th June 2010 is a Thursday instead
Thanks in advance for all your kind help!
