I would like to scatter in 3d a tSNE plot with plotly. I performed the same kind of plotting in 2d with no problem This is the function call:
pl <- plot_ly(tsne_df, x = ~tSNE1, y = ~tSNE2, z = ~tSNE3, color = ~cell_clustering, colors = color_clusters)
    add_markers() %>%
    layout(scene = list(xaxis = list(title = 'x-tSNE'),
                        yaxis = list(title = 'y-tSNE'),
                        zaxis = list(title = 'z-tSNE')))
Regularly rendered with renderPlotly and shown it in UI with plotlyOutput. No error message but I am not able to see the plot. Only a small part of it (see the images).
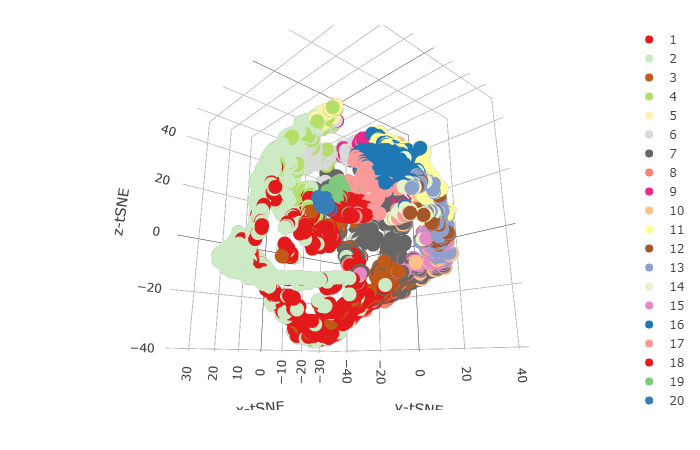
Only when saving as png. I am using chrome and also MS edge. Very strange. I know about the problem with the Rstudio viewer but actually the only plot I could see came out from the Rstudio viewer, generated through an rMarkdown doc which I am using to test the code I am implementing in my shiny webapp.
This is what I see in rMarkdown:
And this what I got in shiny