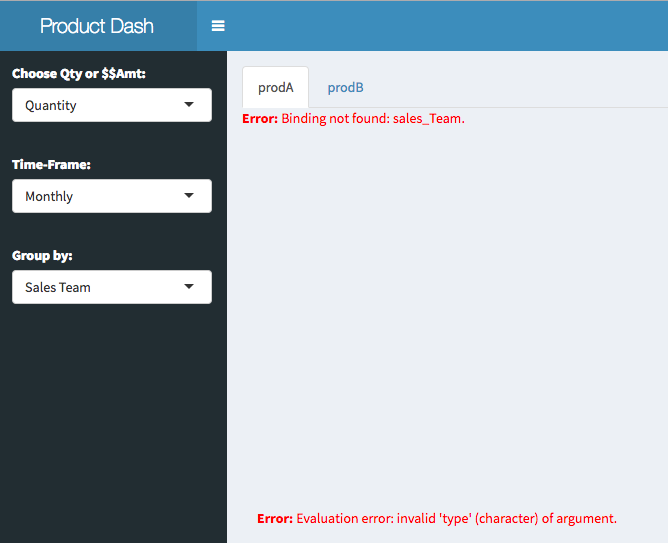
My app is a simple dashboard that outputs a line-plot and a value-box based on selectInput variables that are then passed as reactive variables to a shiny module. This is the error message I get with the code (follows after the screenshot).
The code that produces the error:
library(shiny)
library(shinydashboard)
library(tidyverse)
library(highcharter)

#Create the data set----------------------------------------------------------
set.seed(1)
prod_data <- data.frame(Qty = sample(10:20, 12, replace = TRUE))
prod_data <-
  prod_data %>% mutate(
    Amount = sample(100:200, 12, replace = TRUE),
    sales_Team = sample(c("Americas", "ROW"), size = 12, replace = TRUE),
    Industry = sample(
      c("Advertising", "Education"),
      size = 12,
      replace = TRUE
    ),
    Type = sample(c("prodA", "prodB"), size = 12, replace = TRUE),
    Month = sample(seq(
      as.Date("2016/1/1"), by = "month", length.out = 12
    ), replace = TRUE)
  )


TS_module_UI <- function(id) {
  ns <- NS(id)
  tagList(highchartOutput(ns("hcontainer")),
  valueBoxOutput(ns("val_box1")))

}

# Module server ---------------------------------------------------------------
TS_module <-
  function(input,
           output,
           session,
           data,
           Product_Type,
           x,
           y,
           z) {
    # Select product specific type and group either by Region, SalesTeam or Industry
    TS_with_type <- reactive({
      Time_frame <- x()
      feature <- z()
      bookings <- y()


      data %>%
        filter(Type == as.character(Product_Type)) %>%
        group_by_at(.vars = c(Time_frame, feature)) %>%
summarize_at(vars(bookings), sum)

    })


    #Create the lineplot highcharter object------------------------
    output$hcontainer <- renderHighchart({
      ts_data <- TS_with_type()
      hchart(ts_data, "line", hcaes_string(
        x = x(),
        y = y(),
        group = z()
      ))

    })

    #Create valuebox object------------------------
    output$val_box1 <- renderValueBox({
      tsdata <- TS_with_type()
      valuex <- x()
      valuey <- y()
      valuez <- z()


      result <- tsdata %>%
        summarize(Total_Bookings = sum(!!y)) %>%
        group_by_at(.vars = c(valuez)) %>%
        summarize_at(.vars = c(valuey), sum) %>%
        pull()

      valueBox(
        value = prettyNum(result),
        subtitle = "Total Bookings",
        icon = icon("line-chart"),
        color = "light-blue"
      )
    })

  }

#Define UI---------------------------------------------------------------------

ui <- dashboardPage(
  # Application title ---------------------------------------------------------
  dashboardHeader(title = "Product Dash", titleWidth = 200),

  # Sidebar layout
  dashboardSidebar(
    # Inputs: Select variables to plot ----------------------------------------

    # Select variable for y-axis --------------------------------------------
    selectInput(
      inputId = "y",
      label = "Choose Qty or $$Amt:",
      choices = c("Quantity" = "Qty",
                  "$$ Amt" = "Amount"),
      selected = "Qty"
    ),

    # Select variable for x-axis --------------------------------------------
    selectInput(
      inputId = "x",
      label = "Time-Frame:",
      choices = c("Monthly" = "Month"),
      selected = "Month"
    ),

    # Select variable for grouping ---------------------------------------------
    selectInput(
      inputId = "z",
      label = "Group by:",
      choices = c("Industry" = "Industry",
                  "Sales Team" = "sales_Team"),
      selected = "sales_Team"
    )
  ),

  # Output: -----------------------------------------------------------------
  dashboardBody(# Show line plot per respective tab
    tabsetPanel(
      id = "ts_data",

      tabPanel("prodA", TS_module_UI("productA")),
      tabPanel("prodB", TS_module_UI("productB"))

    ))
)


# Define server--------------------------------------------------------------
server <- function(input, output) {
  x     <- reactive(input$x)
  y     <- reactive(input$y)
  z     <- reactive(input$z)

  callModule(TS_module,
             "productA",
             data = prod_data,
             Product_Type = "prodA",
             x,
             y,
             z)
  callModule(TS_module,
             "productB",
             data = prod_data,
             Product_Type = "prodB",
             x,
             y,
             z)
}

shinyApp(ui = ui, server = server)
Is there an issue with the way I've passed the arguments to the function enquo() or any other approach to resolving this?
Please note: Resolved using group_by_at and summarize_at as per suggestion from Benjamin (@nutterb)