Hello. I'm currently analyzing a Chicago dataset. I have a problem when I plot a map with ggplot by using a shapefile.
First I have succeeded to plot this map, and also I can plot the shapfile only. But when I put the shapefile in the ggplot function, the visualization has an issue. That's my code and the screenshots :
my_spdf <- readOGR(dsn = "mypath", layer="PoliceDistrict")
my_spdf <- spTransform(my_spdf, CRS("+proj=longlat +datum=WGS84"))
plot(my_spdf)
So, before, the map is well plotted, but then :
# I import first the map
upperLeft = c(42.117382, -88)
lowerRight = c(41.6, -87.468548)

base_map  = openmap(upperLeft, lowerRight, type="osm")
plot(base_map)
base <- openproj(base_map, projection = "+proj=longlat +ellps=WGS84 +datum=WGS84 +no_defs")

# Then I plot all
autoplot.OpenStreetMap(base) +
  geom_path(data = my_spdf,
            aes(x = long, y = lat),
            color = 'black')
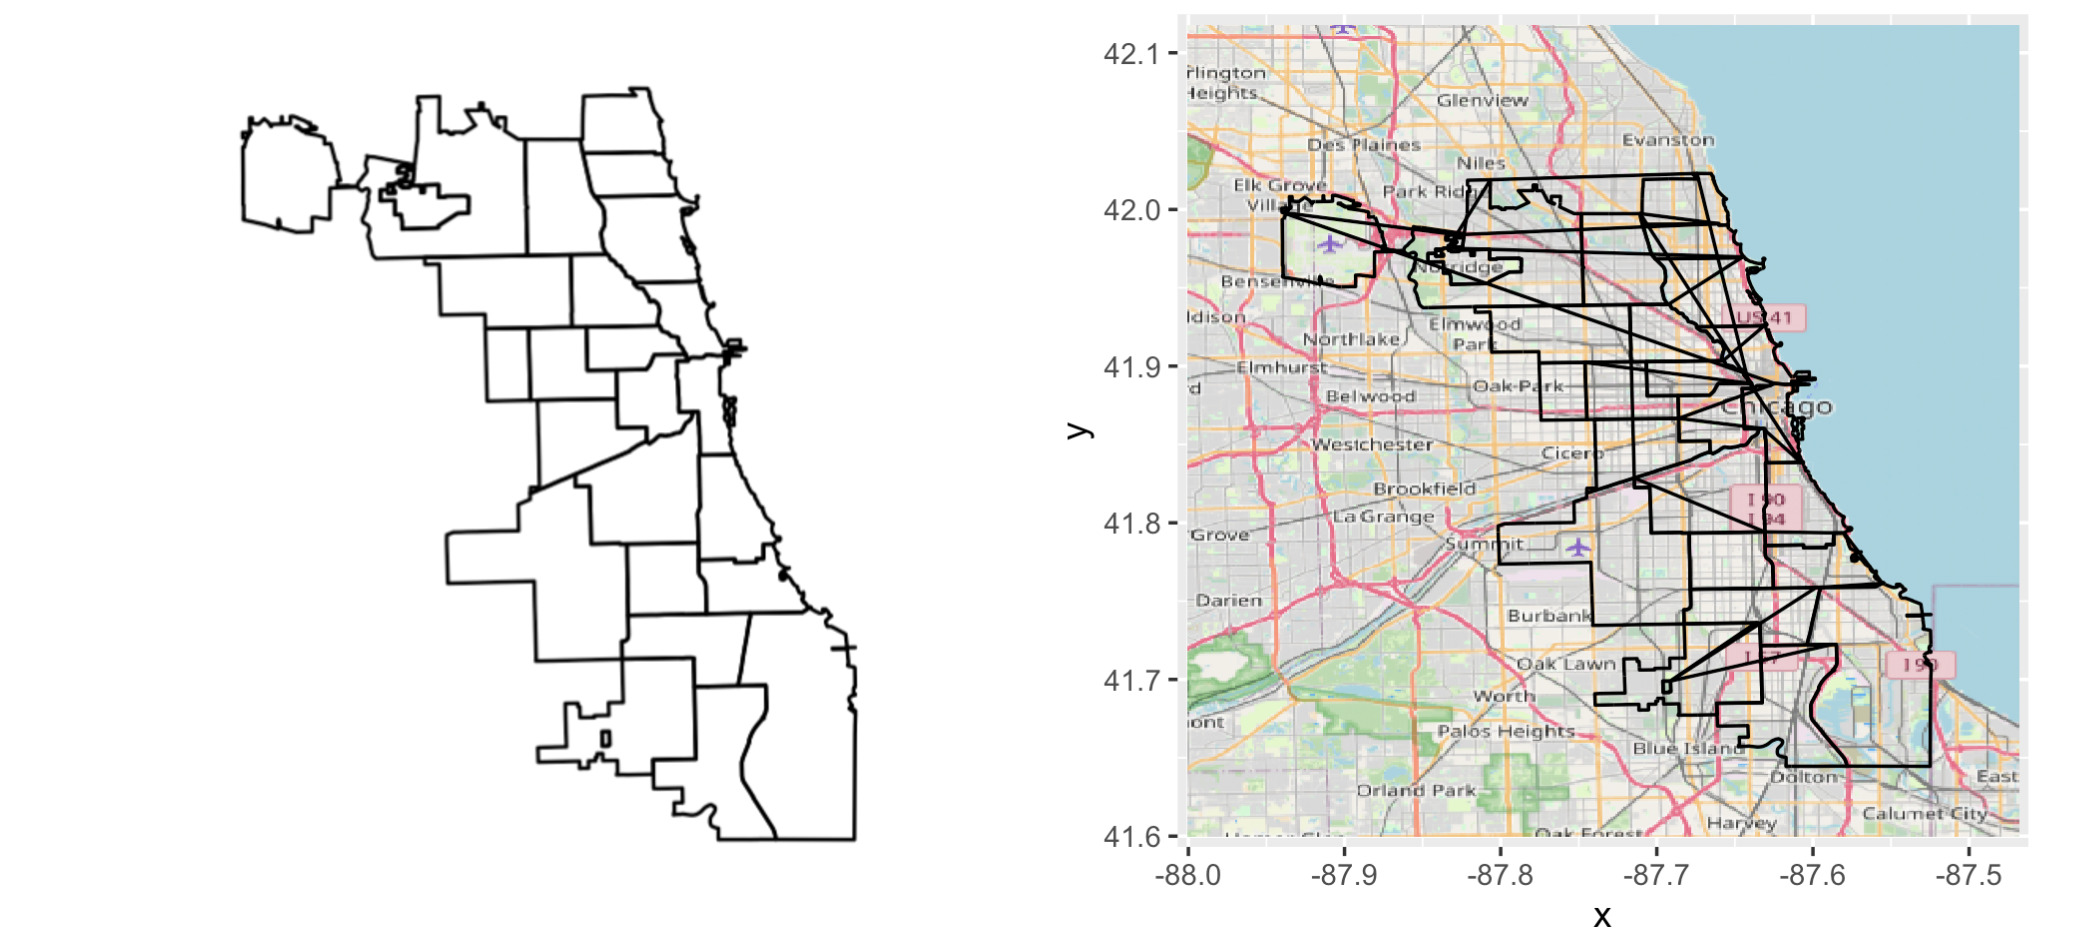
As you can see the map is almost well plotted but, there is some diagonal lines that appear...
If you know how to solve it it would be very great. Thanks in advance !