"Ross, A first course in probability, 9th ed" gives this example
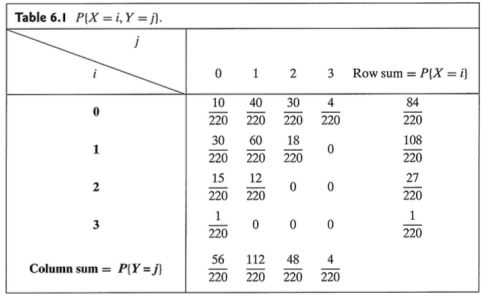
Suppose that 3 balls are randomly selected from an urn containing 3 red, 4 white, and 5 blue balls. If we let X and Y denote, respectively, the number of red and white balls chosen, then the joint probability mass function of X and Y, p(i,j) = P{X=i,Y=j}, is given by
Is there an R package could be used to plot such a table?