F is a function and Vectorize(F) is the vectorized version of F, which is also a function. The errors you're getting are due to running quantile on a function, rather than on a vector of numeric values. For example, substitute mean for F in the calls to quantile and you'll get the same errors. (Also, you probably wanted probs = c(0.25, 0.5, 0.75) or probs = seq(0.25, 0.75, 0.25). If you run seq(0.25, 0.50, 0.75) you'll see that it returns only 0.25.)
Looking at the function F itself, note that once you vectorize it, if(any(t >= 0)) is the same as if(t >= 0) because vectorizing means that the function F operates separately on each element of the input vector t. For example:
F2 <- function(t) {
  if(t >= 0) (1 + (-1)/(1 + t^2)) else (0)
}

x = -10:10

identical(Vectorize(F)(x), Vectorize(F2)(x))
TRUE
For the plot, first, let's save the vectorized version of F as its own object, so we don't have to keep writing Vectorize(F):
VF = Vectorize(F)
Did you want to plot the result of running VF on a specific data vector, or did you want to plot the VF function on a generic grid of t values? Your code does the second of these. Your code is equivalent to:
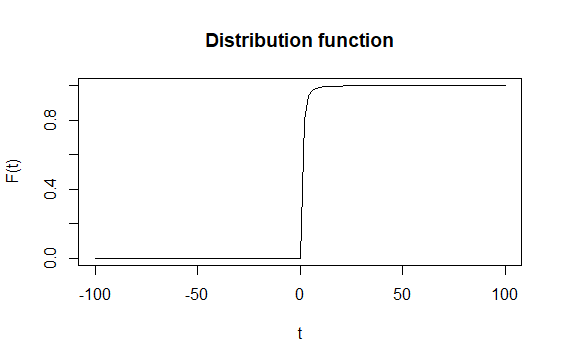
plot(VF, xlim=c(-100,100))
which means plot is being run on a function, rather than on data values. When you run plot on a function, plot calls the curve function, which plots the result of the function on a grid of input values. The grid range is c(0,1) by default, but c(-100,100) in this case, since you specificed xlim.1 You would get the same plot if you did the following:
x = seq(-100, 100, length=100)
fx = VF(x)

plot(x, fx, type="l")
Now, back to the quantiles: Are you thinking of Vectorize(F) (or VF) as a probability density function? Or is it a cumulative distribution function? It looks like a cumulative distribution function. Maybe I'm just misunderstanding what you're trying to do. Can you say more about what you want quantiles of?
1 You can figure this out by running methods(plot) and noting that this returns a bunch of "methods," one of which is called plot.function. (Each "method" is a different function that gets "dispatched" by plot depending on what type of object you input to the function. In this case, plot was fed a function, so it dispatched plot.function.) If you type ?plot.function in the console, it opens the help for the curve function. Also, if you look at the code for plot.function (by typing plot.function in the console), you can see that the last thing it does is call the curve function.