Hi @cymon,
thanks for the suggestions! I agree that geoms are not a perfect fit here. However, I also think that there must exist some low-level solution.
The visualisations are for some standard presentations and we discussed relatively long about this issue, so I am also curious about a solution in general.
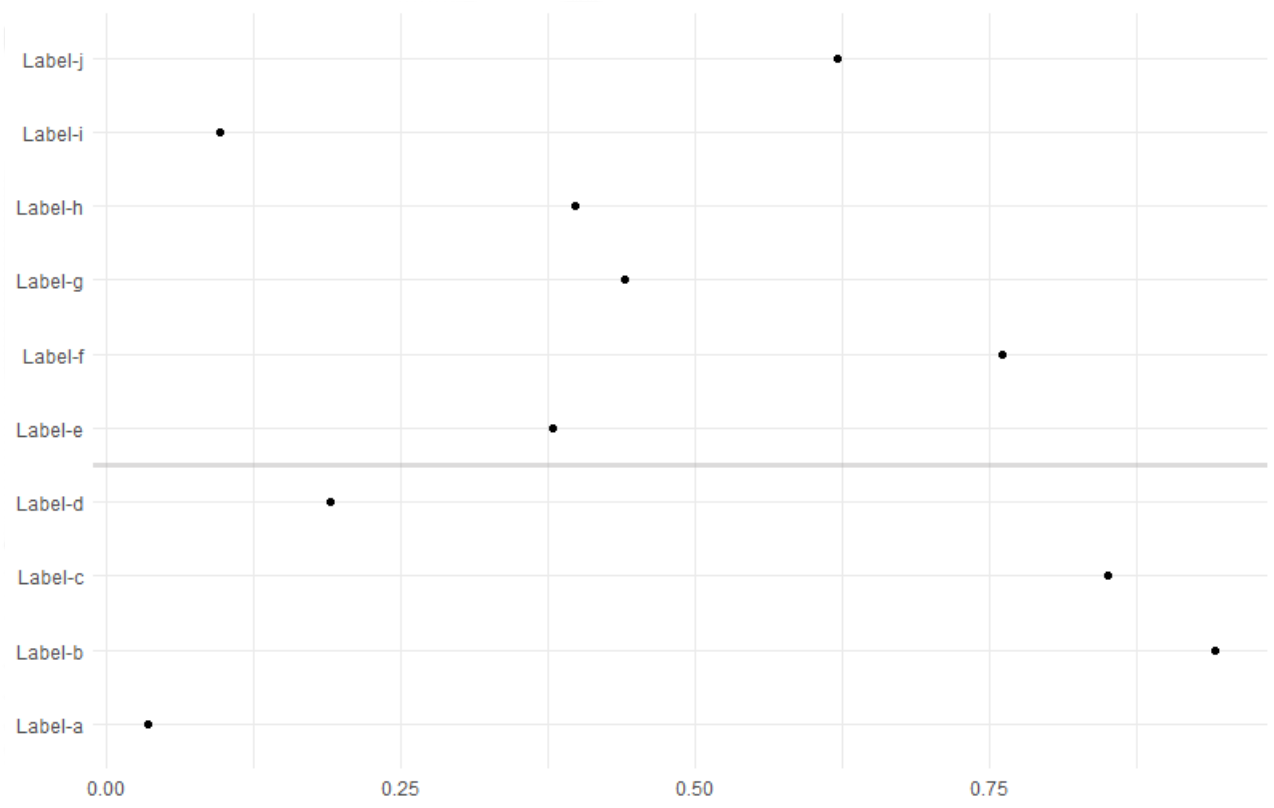
I also really like your alternative approach. Just as you mention it has other downsides. Since the output was missing, I include it here again.
library(dplyr)
ibrary(ggplot2)

tibble(
  labels = paste0("Label-", letters[1:10]),
  value  = runif(10, 0, 1),
  top = c(rep(1,6), rep(2,4))
) %>%
  ggplot(aes(x = labels, y = value)) +
  facet_grid(top ~ ., scales = "free") +
  geom_point() +
  coord_flip() +
  theme_minimal() +
  theme(axis.title = element_blank(),
        panel.border = element_rect(fill="transparent"),
        strip.background = element_blank(),
        strip.text.y = element_blank())
Created on 2019-12-03 by the reprex package (v0.3.0)
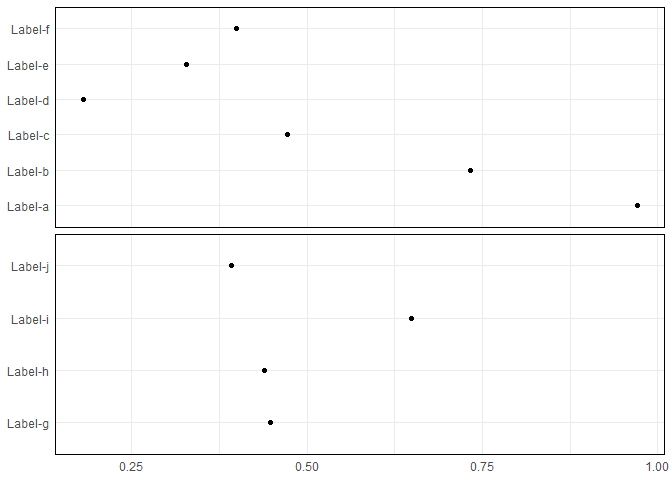
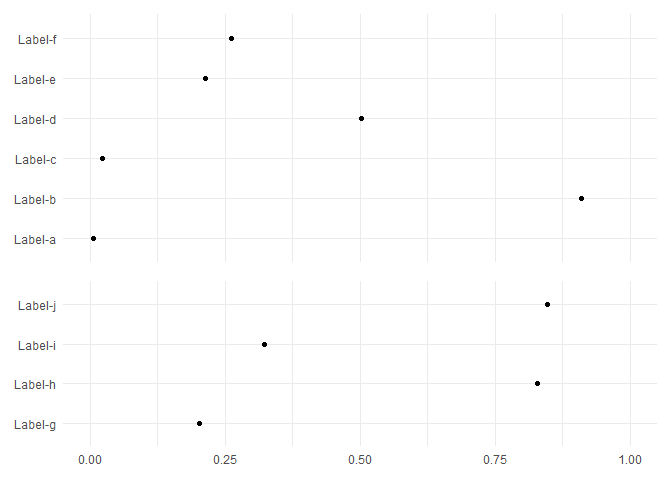
Your approach also inspired me to another approach via patchwork, which allows to adjust the scales relatively easy.
library(dplyr)
library(ggplot2)
library(patchwork)

data <- tibble(
  labels = paste0("Label-", letters[1:10]),
  value  = runif(10, 0, 1),
  top = c(rep(1,6), rep(2,4))
)

p1 <- data %>%
  filter(top == 1) %>%
  ggplot(aes(x = labels, y = value)) +
  geom_point() +
  ylim(c(0,1)) +
  coord_flip() +
  theme_minimal() +
  theme(axis.title = element_blank(),
        axis.text.x = element_blank())

p2 <- data %>%
  filter(top == 2) %>%
  ggplot(aes(x = labels, y = value)) +
  geom_point() +
  coord_flip() +
  ylim(c(0,1)) +
  theme_minimal() +
  theme(axis.title = element_blank())

p1 / p2 + plot_layout(heights = c(1, 4/6))
Created on 2019-12-03 by the reprex package (v0.3.0)