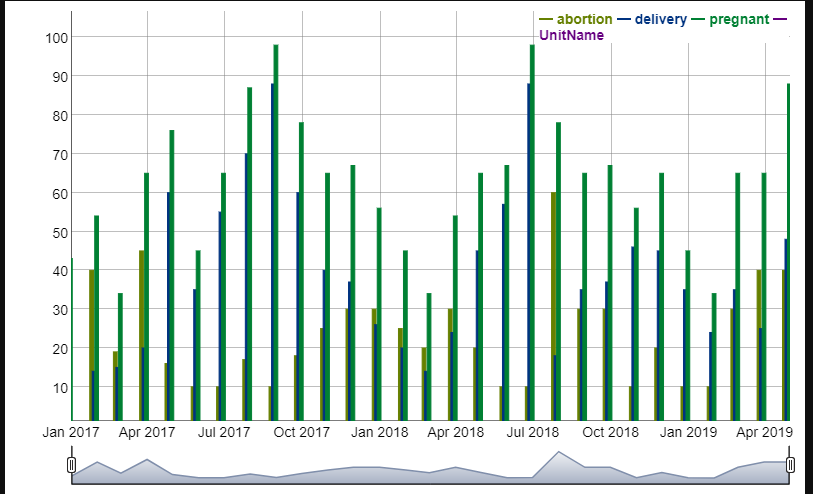
I wanna display the respective unit name too along with all the other columns which contain values, is it possible and how to get it done if it is...
```{r}
library(dygraphs)
library(xts)
library(lubridate)
library(tidyverse)
data <- tibble::tribble(
~month, ~UnitName, ~abortion, ~delivery, ~pregnant,
"01-01-2017", "a", 13, 30, 43,
"01-02-2017", "b", 40, 14, 54,
"01-03-2017", "c", 19, 15, 34,
"01-04-2017", "d", 45, 20, 65,
"01-05-2017", "e", 16, 60, 76,
"01-06-2017", "f", 10, 35, 45,
"01-07-2017", "g", 10, 55, 65,
"01-08-2017", "h", 17, 70, 87,
"01-09-2017", "i", 10, 88, 98,
"01-10-2017", "j", 18, 60, 78,
"01-11-2017", "k", 25, 40, 65,
"01-12-2017", "l", 30, 37, 67,
"01-01-2018", "m", 30, 26, 56,
"01-02-2018", "n", 25, 20, 45,
"01-03-2018", "o", 20, 14, 34,
"01-04-2018", "p", 30, 24, 54,
"01-05-2018", "q", 20, 45, 65,
"01-06-2018", "r", 10, 57, 67,
"01-07-2018", "s", 10, 88, 98,
"01-08-2018", "t", 60, 18, 78,
"01-09-2018", "u", 30, 35, 65,
"01-10-2018", "v", 30, 37, 67,
"01-11-2018", "w", 10, 46, 56,
"01-12-2018", "x", 20, 45, 65,
"01-01-2019", "y", 10, 35, 45,
"01-02-2019", "z", 10, 24, 34,
"01-03-2019", "aa", 30, 35, 65,
"01-04-2019", "bb", 40, 25, 65,
"01-05-2019", "cc", 40, 48, 88
)
data$datetime <- dmy(data$month)
don <- xts(x = data[,], order.by = data$datetime)
dyMultiColumn <- function(dygraph) {
dyPlotter(dygraph = dygraph,
name = "MultiColumn",
path = system.file("plotters/multicolumn.js",
package = "dygraphs"))}
ad <- cbind(don$abortion,don$delivery,don$pregnant)
dygraph(ad) %>%
dyRangeSelector() %>%
dyMultiColumn()
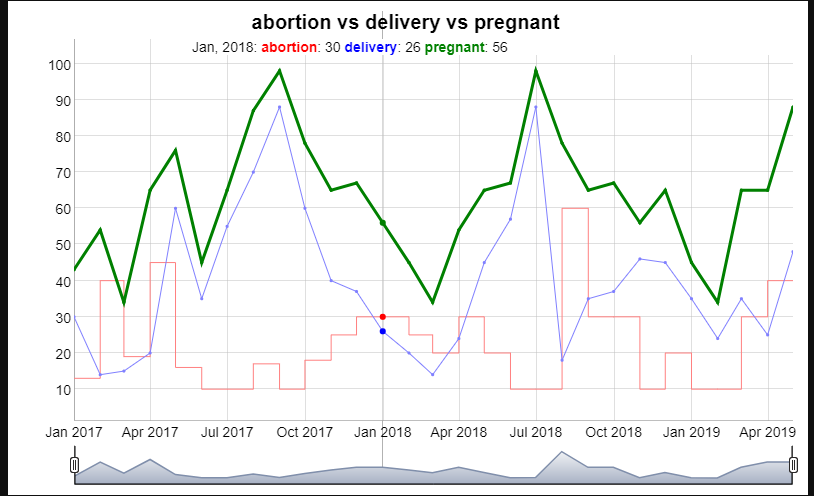
dygraph(ad, main = "abortion vs delivery vs pregnant") %>%
dySeries("abortion", stepPlot = TRUE, color = "red") %>%
dyGroup(c("delivery", "pregnant"), drawPoints = TRUE, color = c("blue", "green")) %>%
dyLegend(width = 550) %>%
# dyHighlight(highlightCircleSize = 5,
# highlightSeriesBackgroundAlpha = 0.2,
# hideOnMouseOut = FALSE)
dyHighlight(highlightSeriesOpts = list(strokeWidth = 3)) %>%
dyRangeSelector() %>%
# dyRoller(rollPeriod = 1) %>%
dyUnzoom() %>%
dyCrosshair(direction = "vertical")
I tried to add it like other value columns but it didn't work out, could anyone please tell me how to achieve the same.
ad <- cbind(don$abortion,don$delivery,don$pregnant,don$UnitName)
dygraph(ad) %>%
  dyRangeSelector() %>%
  dyMultiColumn()
dygraph(ad, main = "abortion vs delivery vs pregnant") %>%
  dySeries("abortion", stepPlot = TRUE, color = "red") %>%
  dyGroup(c("delivery", "pregnant","UnitName"), drawPoints = TRUE, color = c("blue", "green","red")) %>%
   dyLegend(width = 600) %>%