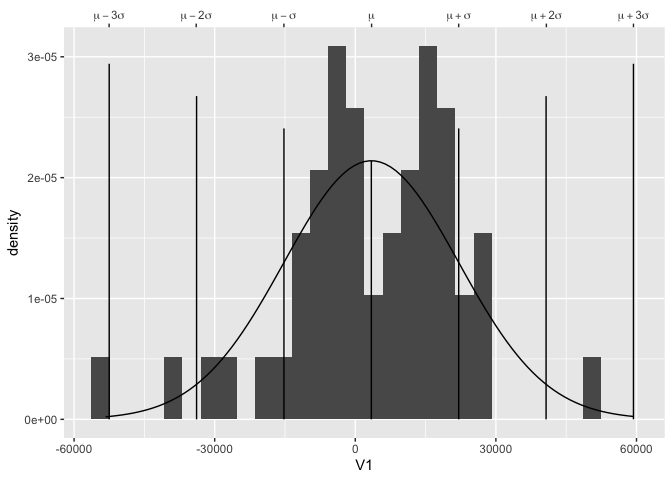
I know you're looking for a non-ggplot solution, @KGee, but just in case you're curious or might change your mind, here's a start, without the text from your linked image:
normality_data <-
  structure(list(V1 = c(49119L, 2799L, 19533L, 19059L, 24123L,
                        -8553L, -3921L, 2199L, 14559L, 26403L, -2787L, -40191L, -273L,
                        -53265L, 20661L, -4113L, 16359L, 7911L, 10083L, -10731L, -8661L,
                        16701L, 10605L, 16107L, -2223L, -30225L, -12333L, 1761L, 22755L,
                        -3525L, 14649L, 17451L, -28893L, 6351L, -11073L, 27279L, 20769L,
                        13521L, -399L, -9393L, 21255L, -165L, -7431L, 8409L, 28287L,
                        11331L, -18675L, -4713L, -15567L, -1749L)), .Names = "V1", row.names = c(NA,
                                                                                                 50L), class = "data.frame")
### end of 'structure()' command
library(tidyverse)

# collect mean, standard deviation points, and max value of desired gaussian
mu <- normality_data %>% pull(V1) %>% mean()
sigma <- normality_data %>% pull(V1) %>% sd()
sigmas <- seq(mu - 3 * sigma, mu + 3 * sigma, sigma)
gauss_top <- dnorm(mu, mean = mu, sd = sigma)

# set heights of lines to add at each sigma
sigma_heights <- gauss_top + abs(-3:3) * gauss_top / 8

normality_data %>%
  ggplot(aes(V1)) +
  geom_histogram(aes(y = ..density..)) +
  scale_x_continuous(
    sec.axis =
      dup_axis(
        name = NULL,
        breaks = sigmas,
        labels =
          c(quote(mu - 3*sigma),
            quote(mu - 2*sigma),
            quote(mu - sigma),
            quote(mu),
            quote(mu + sigma),
            quote(mu + 2*sigma) ,
            quote(mu + 3*sigma)
          )
      )
  ) +
  stat_function(fun = dnorm, args = list(mean = mu, sd = sigma)) +
  geom_segment(
    data =
      tibble(sigma = sigmas, height = sigma_heights),
    aes(x = sigma, xend = sigma, y = 0, yend = height)
  )
#> `stat_bin()` using `bins = 30`. Pick better value with `binwidth`.
Created on 2020-03-09 by the reprex package (v0.3.0)