Hello R community.
I have 3 question regarding histogram a plot. I'm trying to add the line but I cant make it.
I wrote this:
normality_data<- read.table("/home/kgee/Desktop/data", fill=TRUE)
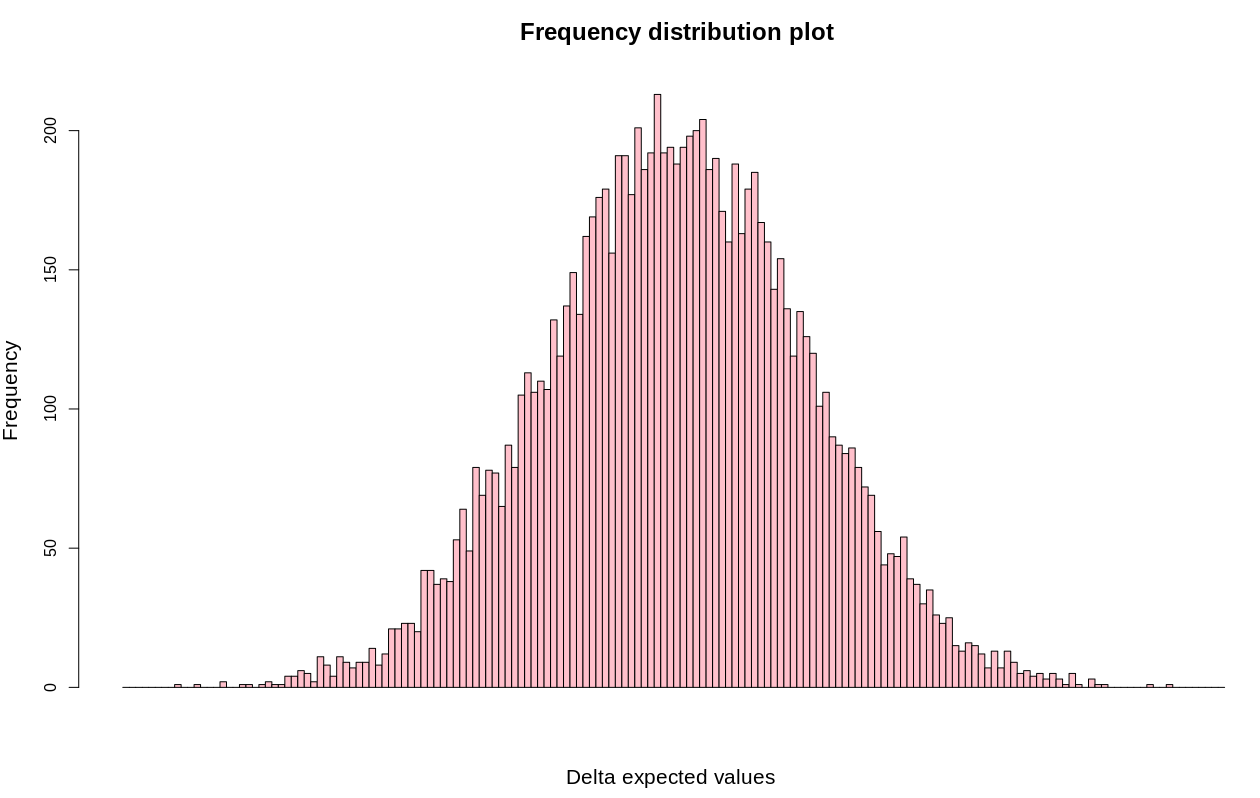
r<-hist(normality_data$V1,span,right=FALSE,col="pink",
main = "frequency distribution plot" ,cex.main=1.5,
xlab=" Expected values ",cex.lab=1.3,xaxt="n")
axis(1, at=r$mids, labels=levels(span))
which works .
r contains:
breaks :-> double [171]
courts :-> integer [170]
density : -> double [170]
mids :-> double [170]
xname ;-> character[1]
equidist :-> logical[1]
and normality_data contains one column of 10000 entries.
i tried these :
points(seq(min(span), max(span), length.out=500),
               dnorm(seq(min(span), max(span), length.out=500),
                     mean(span), sd(span)), type="l", col="blue")

 xfit<-seq(min(normality_data),max(normality_data),length=40)
        yfit<dnorm(xfit,mean=mean(normality_data$V1),sd=sd(normality_data$V1))
 yfit <- yfit*diff(r$mids)*length(normality_data$V1)
 lines(xfit, yfit, col="blue", lwd=2)


lines(r, lty = 8, border = "black")
        lines (span,r$breaks)


lines(density(),col="black",lwd=4)
First question: Is it possible to add a line in this kind of plot ? ( Im trying not to use ggplot so I am wondering if / and how can I make the Gauss curve in this plot))
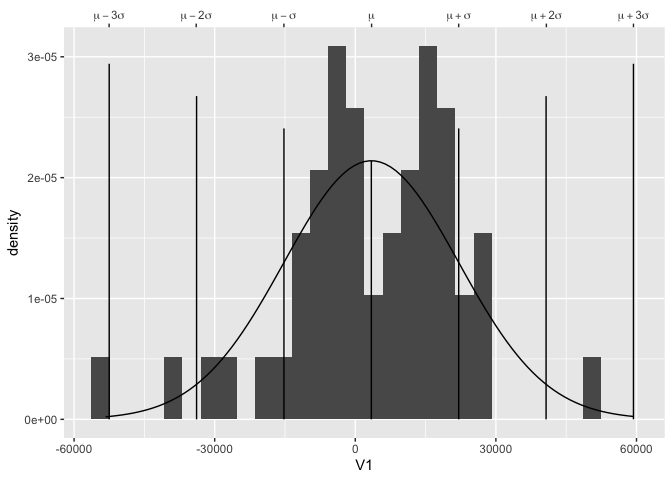
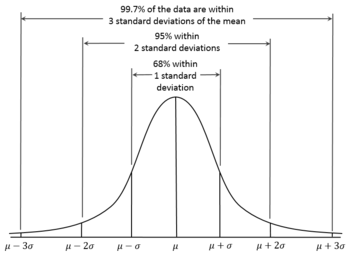
Second question : Is it possible to information on the x axis like the image below? (μ+2σ etc)
image
Third question: If the answer of the first question is positive, Is it possible to combine multiple lines in one plot?
Thanks in advance.