I wrote a code about a mix PCA (FAMD - factor analysis of mixed data), where I have a dataset with some categorical variable and some numerical variable. This is my example code in R:
    library(dplyr)
library(PCAmixdata)

data <- starwars
db_quali <- as.data.frame(starwars[,4:6])
db_quanti <- as.data.frame(starwars[,2:3])

pca_table <- PCAmix(X.quanti = db_quanti,
                    X.quali = db_quali,
                    rename.level=TRUE,
                    graph = TRUE)
Gender <- factor(data$gender)

par(xpd=TRUE,mar=rep(8,4))
plot(pca_table ,choice="ind",label=FALSE,
     posleg=xy.coords(2,-10), main="Observations", coloring.ind = Gender)
and the output graph is:
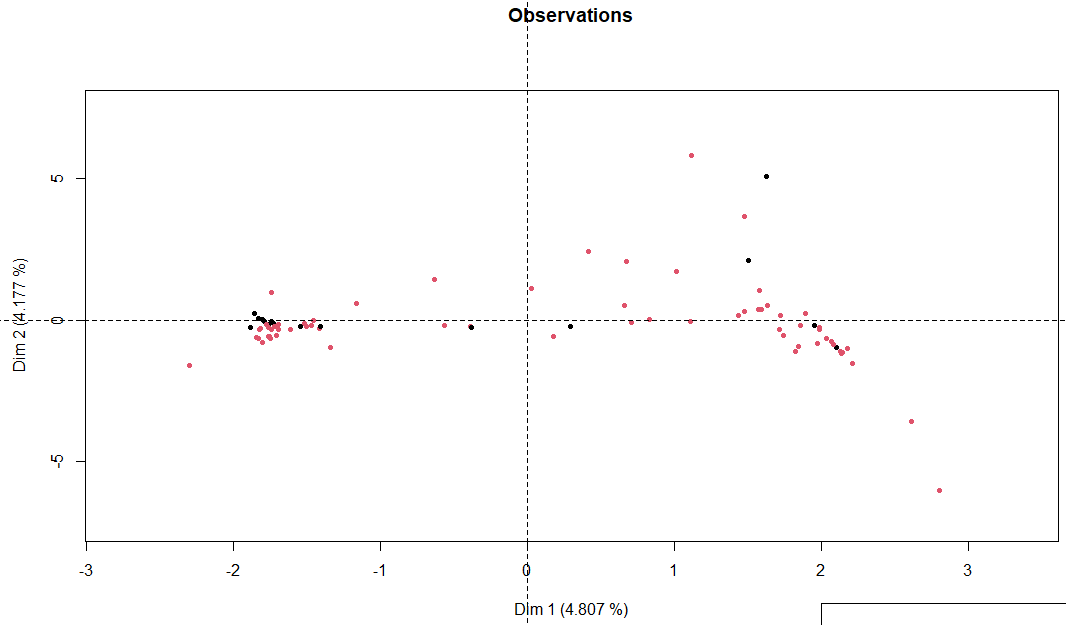
How this method calculate the coordinate of each the observation? What do the numbers on the axes correspond to?
Please send me some useful link to pdf, slide, YouTube video or whatever.. I'm searching information on the internet but I can't find anything.