I am looking for a way do linear interpolation between one variable (inv) based the days between another date variable (mth) with the output being a daily time series with interpolated "inv" values. The data series appears to be "quasi" weekly, so the days vary between each observation of "mth", which is proving to be very difficult. I have limited experience wtih R and date calculations, so that's a huge part of my problem. The dataframe is large, but so I created a simple dataframe example below (hopefully a reprex) to illustrate the problem.
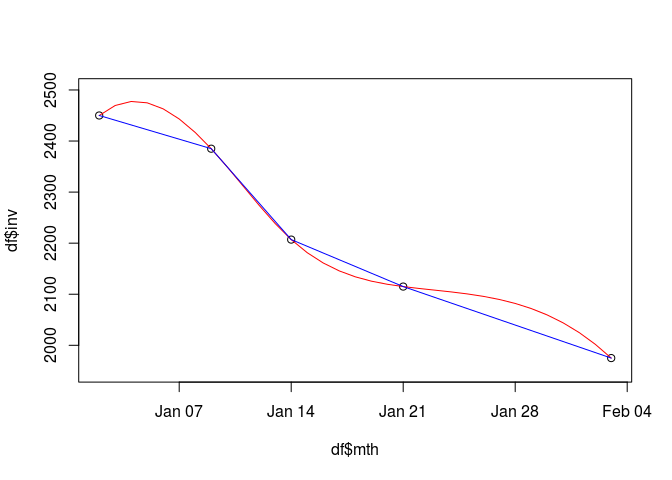
The code below produces a vector of linearly interpolated values called LinearFit and also a cubic spline interpolation that provides a smoother curve.
Thanks for your help. Sorry I'm on steep learning curve here, so excuse my ignorance. I am not familiar with approxfun. It appears to be a matrix with x and y values. I need to do further number crunching on the interpolated values. How do I get the dates and interpolated values into a dataframe object so I can perform further calculations.
Very helpful. I learned a lot. Thanks for sharing.
I now have another related question. I have interpolated the values going back 10 years. I now need to determine the min and max values for each day for the prior 3 years through the dataframe. I can do this with mutate, select days for last 3 years, calculate min and max, etc., but this seems like it's very inefficient. Is there a more efficient approach I should consider? I'm trying to be as efficient as possible because I will be applying this code to much larger dataframes.
Do I understand correctly that you want to look in a window of time three years wide and calculate the max and min values, then slide the window by one day and repeat?
Sorry for the delay, and for not being clear. No, I wanted to look at the min, max and average for the interpolated values for the same day in the last 5 years. For example, max(2019-01-14, 2018-01-14, 2017-01-14, 2016-01-14, 2015-01-14).
I would start with code like the following. The columns for MinYear and MaxYear are not necessary, but if you will have several data frames like this, it might help you keep track of what you are looking at.
library(lubridate)
#>
#> Attaching package: 'lubridate'
#> The following object is masked from 'package:base':
#>
#>     date
library(dplyr)
#>
#> Attaching package: 'dplyr'
#> The following objects are masked from 'package:lubridate':
#>
#>     intersect, setdiff, union
#> The following objects are masked from 'package:stats':
#>
#>     filter, lag
#> The following objects are masked from 'package:base':
#>
#>     intersect, setdiff, setequal, union
#make fake data
df <- data.frame(Date = seq.Date(from = ymd("2015-01-01"), to = ymd("2019-12-31"), by = 1),
                 Value = runif(1826, 0, 5))

df <- df %>% mutate(Year = year(Date), Mnth = month(Date), Day = day(Date))
Stats <- df %>% group_by(Mnth, Day) %>%
  summarize(Avg = mean(Value), Max = max(Value), Min = min(Value),
            MinYear = min(Year), MaxYear = max(Year))
head(Stats)
#> # A tibble: 6 x 7
#> # Groups:   Mnth [1]
#>    Mnth   Day   Avg   Max   Min MinYear MaxYear
#>   <dbl> <int> <dbl> <dbl> <dbl>   <dbl>   <dbl>
#> 1     1     1  2.72  4.26 1.38     2015    2019
#> 2     1     2  2.46  3.60 1.16     2015    2019
#> 3     1     3  1.82  3.81 0.492    2015    2019
#> 4     1     4  3.38  4.64 0.938    2015    2019
#> 5     1     5  2.98  4.50 1.24     2015    2019
#> 6     1     6  2.32  4.25 0.148    2015    2019
Created on 2019-05-16 by the reprex package (v0.2.1)
I am not sure how you want to handle your data set of ten years; either stepping through 2010-2014, 2011-2015 ... 2015-2019 or just do two calculations 2010-2014 and 2015-2019. In either case, you can construct a for loop and use the filter() function to grab the subset that you need. Each output data frame can be stored in a list. I can provide more detail if you can explain how you want to split up the years.