G'day mates:
I have recently installed RStudio for doing some test of a few small lectures I will gave as an introductory kind of course (more like a side part of another ocurse in which we use R)
I found the way to make automated Roxy skeletons, but I wonder if there is a keybind or something to open the roxy skeleton in html format in the help panel of RStudio (or in a web browser) interactively.
For example, with this dummy function:
 ##' Function to scale variables
 ##'
 ##' Rescale function scale numerical vectors by subtracting the original mean and dividing by the standard deviation
 ##' @title Rescale
 ##' @param Data the original vector to be scaled
 ##' @return a numerical vector
 ##' @author Fer
 Rescale <- function(Data){
   ScaledData <- (Data - mean(Data)) / sd(Data)
   return(ScaledData)
 }
I would like to get something like:
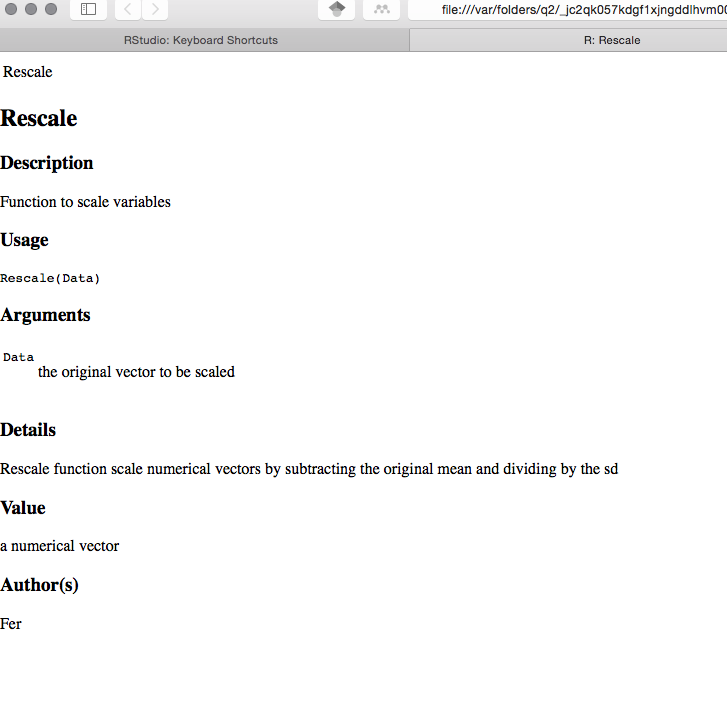
Either in The RStudio IDE or in a web browser (the screenshot is from a browser)
cheers and thanks in advance
Fer