Author: Kyle Cuilla - Twitter @kc_analytics - LinkedIn - GitHub kcuilla (Kyle Cuilla) - Website
View the Table building tutorial - Repo
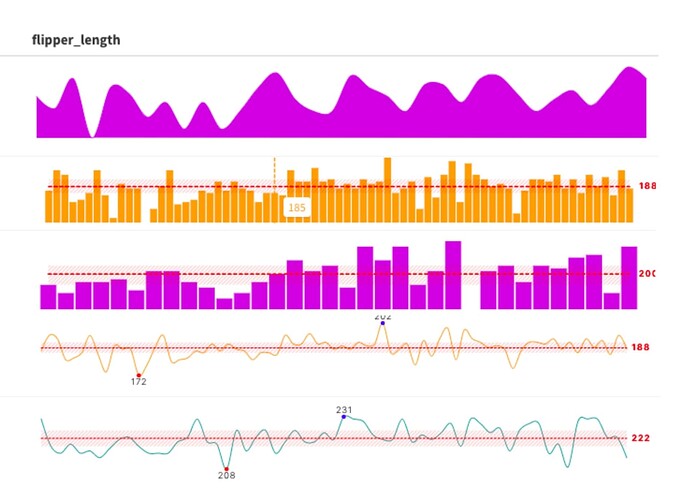
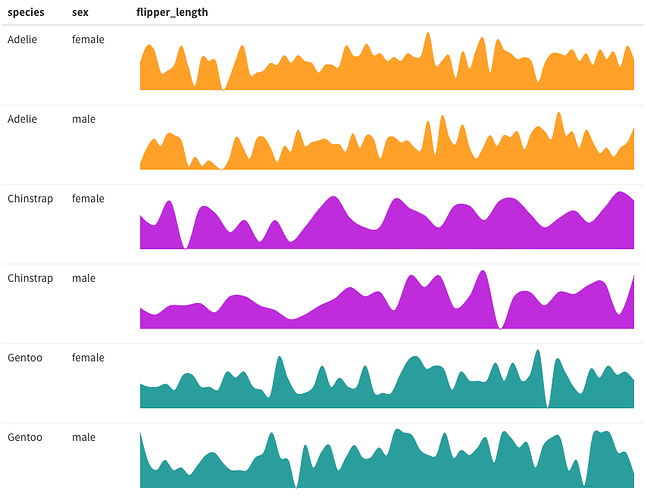
Example #1: react_sparkline() with the filled area shown:
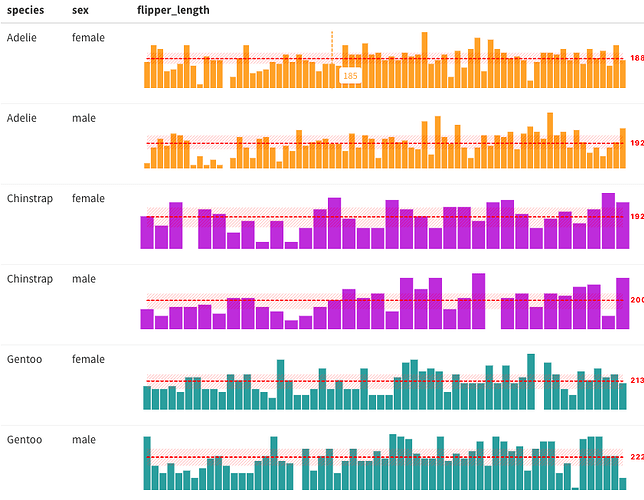
Example #2: react_sparkbar() with the innerquartiles and mean lines applied. The cursor was left over the first row (point 185) to show the interactive tooltip:
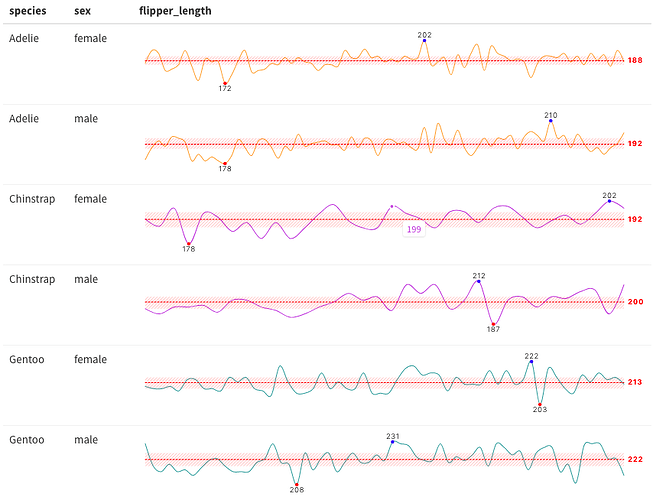
Example #3: react_sparkline() with the innerquartiles and mean lines applied as well as call-outs for the min and max data point for each series. The cursor was left over the third line (point 199) to show the interactive tooltip matches the color of the line the user hovers over:


