Good morning.
I used a mixed model with a fixed effect and a random effect. The random effect are the different subjects.
I would need to find these numbers to replot this graph in graphpad:
- blue dot = average of the fixed effect of each subject
- black bars = 95% confidence interval of the fixed effect for each subject.
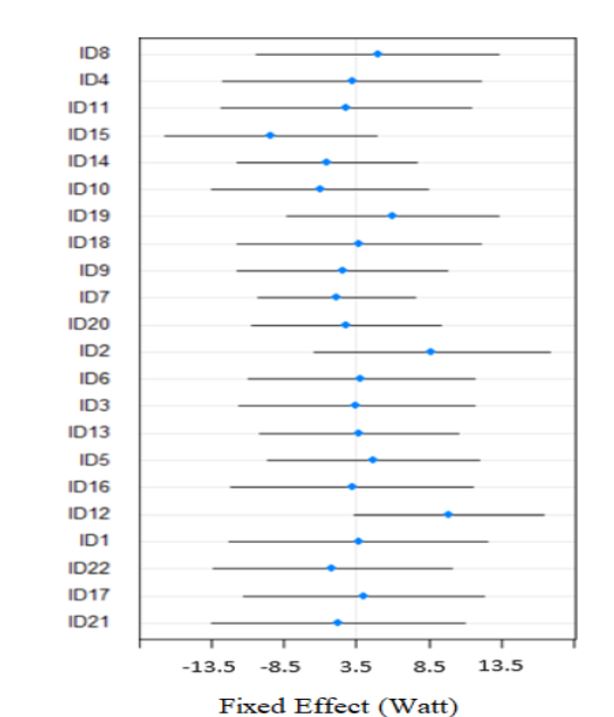
Can anyone help me? what code can i use?
Could you give me some other graphic or numerical ideas to explain the intra and interindividual variability in the fixed effect?
thank you so much