I would like to insert new coordinates in my scatterplot, from another matrix. I am using the fviz_cluster function to generate the graph for the clusters. I would like to insert the coordinates of the matrix called Center of mass in my graph, as they are the best coordinates of each cluster for installing a manure composting machine. I can generate the scatter plot only for the properties, as attached. The codes are below:
library(readxl)
df <- read_excel('C:/Users/testbase.xlsx') matrix containing waste production, latitude and longitude
dim (df)
[1] 19 3
d<-dist(df)
fit.average<-hclust(d,method="average")
clusters<-cutree(fit.average, k=6)
df$cluster <- clusters # inserting column with determination of clusters
df
Latitude Longitude Waste cluster
1 -23.8 -49.6 526. 1
2 -23.8 -49.6 350. 2
3 -23.9 -49.6 526. 1
4 -23.9 -49.6 469. 3
5 -23.9 -49.6 285. 4
6 -23.9 -49.6 175. 5
7 -23.9 -49.6 175. 5
8 -23.9 -49.6 350. 2
9 -23.9 -49.6 350. 2
10 -23.9 -49.6 175. 5
11 -23.9 -49.7 350. 2
12 -23.9 -49.7 175. 5
13 -23.9 -49.7 175. 5
14 -23.9 -49.7 364. 2
15 -23.9 -49.7 175. 5
16 -23.9 -49.6 175. 5
17 -23.9 -49.6 350. 2
18 -23.9 -49.6 45.5 6
19 -23.9 -49.6 54.6 6
########Generate scatterplot
library(factoextra)
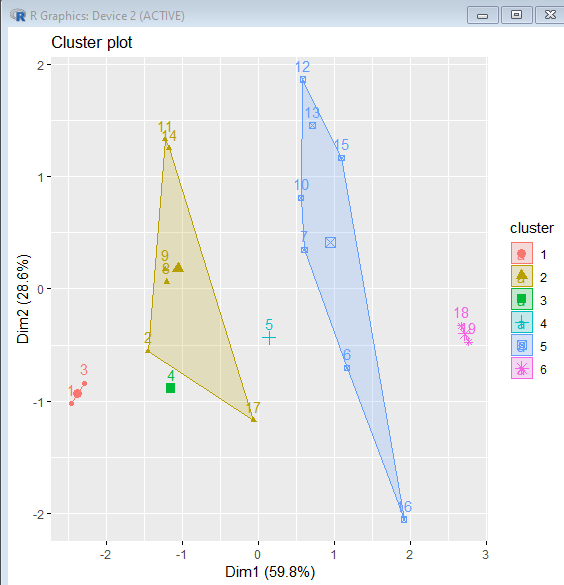
fviz_cluster(list(data = df, cluster = clusters))##Center of mass, best location of each cluster for installation of manure composting machine
center_mass<-matrix(nrow=6,ncol=2)
for(i in 1:6){ center_mass[i,]<-c(weighted.mean(subset(df,cluster==i)$Latitude,subset(df,cluster==i)$Waste), weighted.mean(subset(df,cluster==i)$Longitude,subset(df,cluster==i)$Waste))}
center_mass<-cbind(center_mass,matrix(c(1:6),ncol=1)) #including the index of the clusters
head (center_mass)
[,1] [,2] [,3]
[1,] -23.85075 -49.61419 1
[2,] -23.86098 -49.64558 2
[3,] -23.86075 -49.61350 3
[4,] -23.86658 -49.61991 4
[5,] -23.86757 -49.63968 5
[6,] -23.89749 -49.62372 6