Hello,
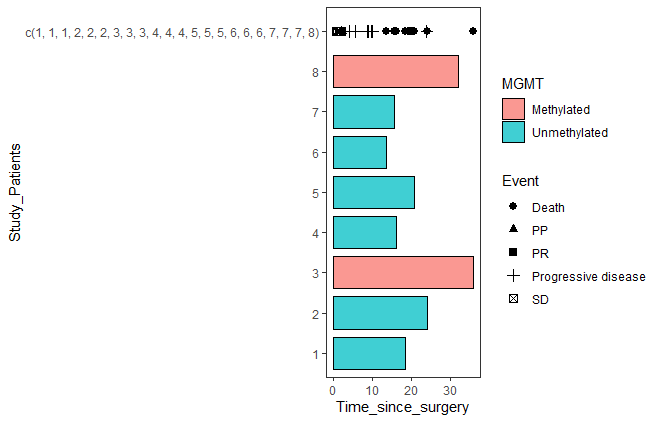
I am new to R studio and I wanted to create a swimmer plot for some data that I made up. When I try to remake the code on different r studio projects, the results seem to be different and inconsistent each time I try to type the code out. For example, I would copy basically the same code in two different R studio screens and each will result in different graphs. The first graph worked out well since dots was overlaid for each patient, but the image below is what I got. All of the dots (events) occurred in one line rather than being distributed.
Why does this occur when I type out the same code for both?
Thank you