Inconsistent graph for swimmer plot data

Hello,
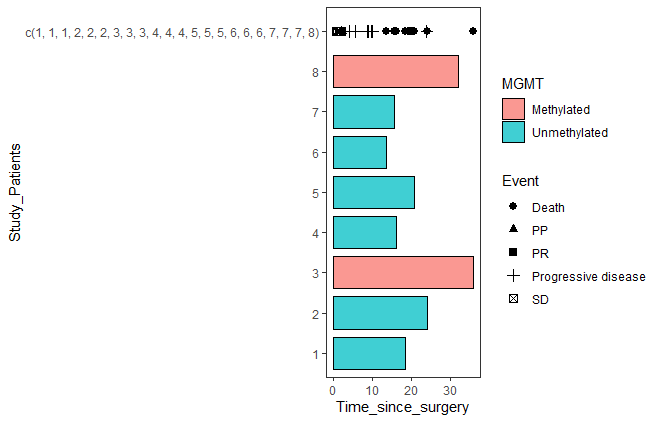
I am new to R studio and I wanted to create a swimmer plot for some data that I made up. When I try to remake the code on different r studio projects, the results seem to be different and inconsistent each time I try to type the code out. For example, I would copy basically the same code in two different R studio screens and each will result in different graphs. The first graph worked out well since dots was overlaid for each patient, but the image below is what I got. All of the dots (events) occurred in one line rather than being distributed.
Why does this occur when I type out the same code for both?

Thank you

Hi!

To help us help you, could you please prepare a reproducible example (reprex) illustrating your issue? Please have a look at this guide, to see how to create one:

Hello!
I mainly used the website "Creating swimmer plots with ease" to write my code. My code consist of:

swimmer_plot(df=ClinicalTrialLength, id = "Study_Patients", end = "Time_since_surgery", fill= 'lightblue', id_order= c('1', '2','3','4','5','6','7','8'), width = 0.85)
plot_with_color<-swimmer_plot(df=ClinicalTrialLength, id= "Study_Patients", end= "Time_since_surgery", name_fill = 'MGMT', id_order = 'Study_Patients', col="black", alpha= 0.75, width = .8)
event_plot<- plot_with_color+swimmer_points(df_points = ClinicalTrialEvents, id= 'ID', time= 'Day_since_surgery', name_shape = 'Event', size= 2.5, fill= 'white', col='black')
If you need more information please let me know!
Thank you!

knitr::kable(head(ClinicalTrialLength,8))

Study_Patients MGMT Date_of_surg Last_day_trial Time_since_surgery
1 Unmethylated 2018-01-02 2019-07-15 18.42
2 Unmethylated 2019-06-08 2021-06-10 24.07
3 Methylated 2017-06-22 2020-06-17 35.87
4 Unmethylated 2018-07-05 2019-11-14 16.30
5 Unmethylated 2018-07-07 2020-04-03 20.90
6 Unmethylated 2019-04-16 2020-06-06 13.70
7 Unmethylated 2019-05-27 2020-09-17 15.70
8 Methylated 2016-12-28 2019-08-28 32.00

knitr::kable(head(ClinicalTrialEvents,22))
| ID|Event_Day |Start_surgery | Day_since_surgery|Event |
|--:|:----------|:-------------|-----------------:|:-------------------|
| 1|2018-02-28 |2018-01-02 | 1.93|SD |
| 1|2018-06-19 |2018-01-02 | 5.57|Progressive disease |
| 1|2019-07-15 |2018-01-02 | 18.42|Death |
| 2|2019-07-26 |2019-06-08 | 1.58|SD |
| 2|2020-03-08 |2019-06-08 | 9.00|Progressive disease |
| 2|2021-06-10 |2019-06-08 | 24.07|Death |
| 3|2019-02-18 |2017-06-22 | 19.96|PR |
| 3|2019-06-20 |2017-06-22 | 23.97|Progressive disease |
| 3|2020-06-17 |2017-06-22 | 35.87|Death |
| 4|2018-09-10 |2018-07-05 | 2.17|PP |
| 4|2019-04-29 |2018-07-05 | 9.80|Progressive disease |
| 4|2019-11-14 |2018-07-05 | 16.30|Death |
| 5|2018-08-02 |2018-07-07 | 0.84|SD |
| 5|2019-05-11 |2018-07-07 | 10.13|Progressive disease |
| 5|2020-04-03 |2018-07-07 | 20.90|Death |
| 6|2019-05-15 |2019-04-16 | 0.94|SD |
| 6|2019-08-16 |2019-04-16 | 4.00|Progressive disease |
| 6|2020-06-06 |2019-04-16 | 13.70|Death |
| 7|2019-07-25 |2019-05-27 | 1.90|SD |
| 7|2020-02-18 |2019-05-27 | 8.76|Progressive disease |
| 7|2020-09-17 |2019-05-27 | 15.70|Death |
| 8|2017-02-01 |2016-12-28 | 1.14|SD |

Your sample data is not copy/paste friendly, please read the guide on the link I gave you before and try to make a proper reproducible example

Sorry for the wait. I am not too sure how to use R so please let me know if this data set works. I tried to follow the video but I am not sure if this is correct.

ClinicalTrialEvents<-tibble::tribble(
  ~ID,   ~Event_Day, ~Start_surgery, ~Day_since_surgery,                ~Event,
    1, "2018-02-28",   "2018-01-02",               1.93,                  "SD",
    1, "2018-06-19",   "2018-01-02",               5.57, "Progressive disease",
    1, "2019-07-15",   "2018-01-02",              18.42,               "Death",
    2, "2019-07-26",   "2019-06-08",               1.58,                  "SD",
    2, "2020-03-08",   "2019-06-08",                  9, "Progressive disease",
    2, "2021-06-10",   "2019-06-08",              24.07,               "Death",
    3, "2019-02-18",   "2017-06-22",              19.96,                  "PR",
    3, "2019-06-20",   "2017-06-22",              23.97, "Progressive disease",
    3, "2020-06-17",   "2017-06-22",              35.87,               "Death",
    4, "2018-09-10",   "2018-07-05",               2.17,                  "PP",
    4, "2019-04-29",   "2018-07-05",                9.8, "Progressive disease",
    4, "2019-11-14",   "2018-07-05",               16.3,               "Death",
    5, "2018-08-02",   "2018-07-07",               0.84,                  "SD",
    5, "2019-05-11",   "2018-07-07",              10.13, "Progressive disease",
    5, "2020-04-03",   "2018-07-07",               20.9,               "Death",
    6, "2019-05-15",   "2019-04-16",               0.94,                  "SD",
    6, "2019-08-16",   "2019-04-16",                  4, "Progressive disease",
    6, "2020-06-06",   "2019-04-16",               13.7,               "Death",
    7, "2019-07-25",   "2019-05-27",                1.9,                  "SD",
    7, "2020-02-18",   "2019-05-27",               8.76, "Progressive disease",
    7, "2020-09-17",   "2019-05-27",               15.7,               "Death",
    8, "2017-02-01",   "2016-12-28",               1.14,                  "SD"
  )
head(ClinicalTrialEvents)
#> # A tibble: 6 x 5
#>      ID Event_Day  Start_surgery Day_since_surgery Event              
#>   <dbl> <chr>      <chr>                     <dbl> <chr>              
#> 1     1 2018-02-28 2018-01-02                 1.93 SD                 
#> 2     1 2018-06-19 2018-01-02                 5.57 Progressive disease
#> 3     1 2019-07-15 2018-01-02                18.4  Death              
#> 4     2 2019-07-26 2019-06-08                 1.58 SD                 
#> 5     2 2020-03-08 2019-06-08                 9    Progressive disease
#> 6     2 2021-06-10 2019-06-08                24.1  Death
This is for ClinicalTrialLength

data.frame(
    stringsAsFactors = FALSE,
      Study_Patients = c(1, 2, 3, 4, 5, 6, 7, 8),
                MGMT = c("Unmethylated",
                         "Unmethylated","Methylated","Unmethylated","Unmethylated",
                         "Unmethylated","Unmethylated","Methylated"),
        Date_of_surg = c("2018-01-02","2019-06-08",
                         "2017-06-22","2018-07-05","2018-07-07","2019-04-16",
                         "2019-05-27","2016-12-28"),
      Last_day_trial = c("2019-07-15","2021-06-10",
                         "2020-06-17","2019-11-14","2020-04-03","2020-06-06",
                         "2020-09-17","2019-08-28"),
  Time_since_surgery = c(18.42, 24.07, 35.87, 16.3, 20.9, 13.7, 15.7, 32)
)
#>   Study_Patients         MGMT Date_of_surg Last_day_trial Time_since_surgery
#> 1              1 Unmethylated   2018-01-02     2019-07-15              18.42
#> 2              2 Unmethylated   2019-06-08     2021-06-10              24.07
#> 3              3   Methylated   2017-06-22     2020-06-17              35.87
#> 4              4 Unmethylated   2018-07-05     2019-11-14              16.30
#> 5              5 Unmethylated   2018-07-07     2020-04-03              20.90
#> 6              6 Unmethylated   2019-04-16     2020-06-06              13.70
#> 7              7 Unmethylated   2019-05-27     2020-09-17              15.70
#> 8              8   Methylated   2016-12-28     2019-08-28              32.00

I am not sure what is happening but you are creating plot_with_color with ClinicalTrialLength and then creating event_plot using * ClinicalTrialEvents* as the data.frame in swimmer_points()

Yes, I did this because in the plot_with_color code I wanted to color each of the separate lines with the information provided in the ClinicalTrialLength. For the event_plot I wanted to create a point for each of the individual events stated in the ClinicalTrialEvents data to correspond to each of the patients. I am not sure why the Event points are all compiled into one line instead of being distributed into each of the patients

I do not think you can do this because the two data sets have different dimensions.
ClinicalTrialEvents is 22 X 5 and ClinicalTrialLength is 8 X 5

There is no one--to--one correspondence.

Hello, I am sorry. I am still very new to this program so I am not sure how to linear regression models.

I see, thank you for giving this problem a try! Perhaps there is another way to get around this problem. Thank you! I will keep on trying and if something works I will be sure to update the post. Thank you!

I eventually was able to reach the answer! I simply needed to create a data frame for each of the data so that the code can recognize the data provided. I am not sure still how this makes sense but it works! Thank you!