I am trying to knit an R Markdown document (to HTML, PDF, or Gitbook format) that includes (base) plots created by a package that (MCMCglmm) automatically (via a plot method) creates them for every coefficient in a model.
My problem is there is no space for them!
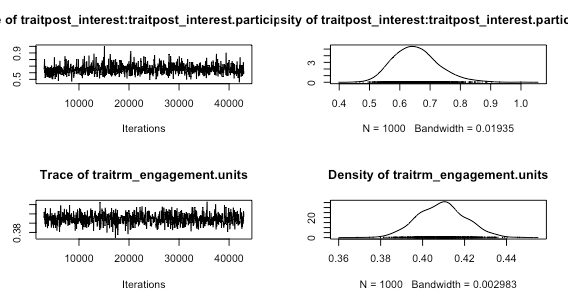
This is how they look in my R Studio plot viewer pane:
But, this is how they look in R Markdown output (whether I render to HTML, PDF, or Gitbook format) - they are too small:
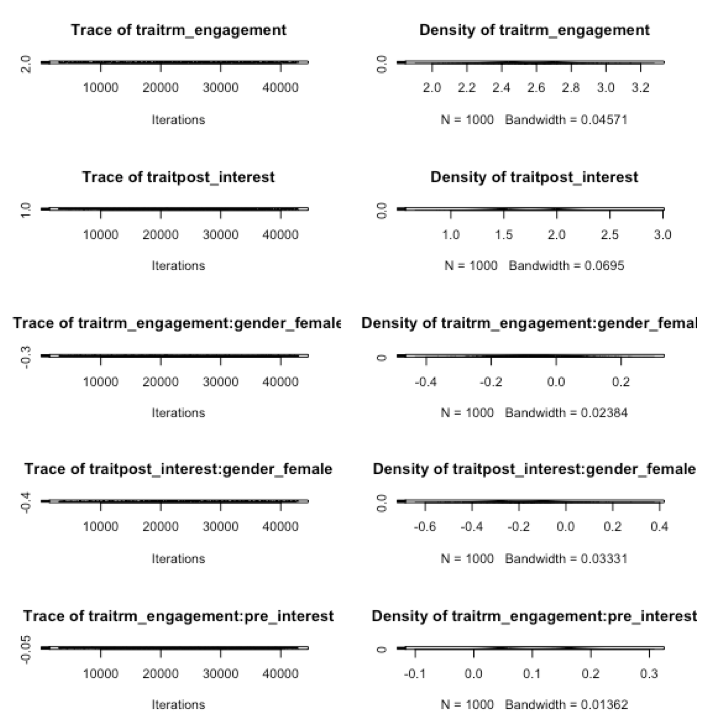
Is there any way I can automatically size these larger? Or, do I need to allocate more size for all of the plots? Some other possible solution?