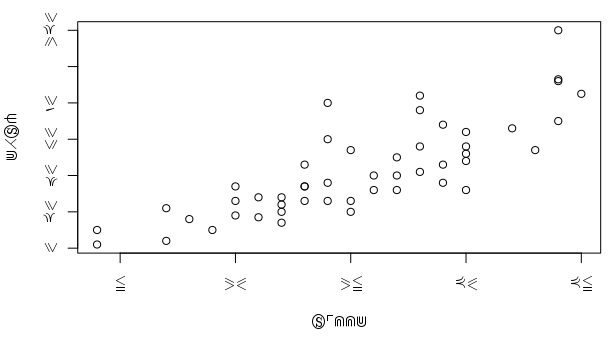
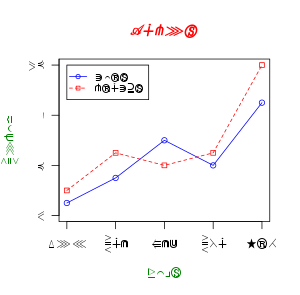
I'm having problems with plots in rstudio server since I upgraded from Oracle Linux to RHEL7. When I execute plot(...), the characters are cryptic: usually some mathematic signs; even the numbers on the axis are cryptic. When I do the plots from inside of R, everything works fine; also when I'm saving the plot with
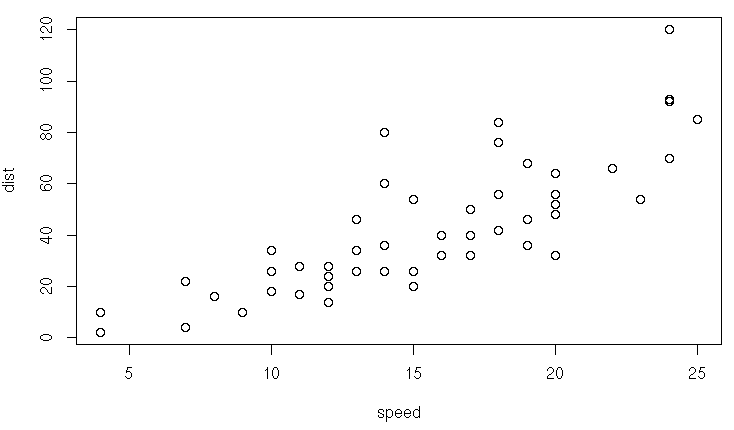
> png("~/cars.png")
> plot(cars)
> dev.off()
So it seems to be originating from rstudio somehow.
capabilities() and sessionInfo() give me the following output:
> capabilities()
       jpeg         png        tiff       tcltk         X11        aqua    http/ftp     sockets      libxml        fifo
       TRUE        TRUE       FALSE        TRUE       FALSE       FALSE        TRUE        TRUE        TRUE        TRUE
     cledit       iconv         NLS     profmem       cairo         ICU long.double     libcurl
       TRUE        TRUE        TRUE       FALSE        TRUE        TRUE        TRUE        TRUE
> sessionInfo()
R version 3.3.3 (2017-03-06)
Platform: x86_64-pc-linux-gnu (64-bit)
Running under: Red Hat Enterprise Linux

locale:
 [1] LC_CTYPE=en_US.UTF-8       LC_NUMERIC=C               LC_TIME=en_US.UTF-8        LC_COLLATE=en_US.UTF-8
 [5] LC_MONETARY=en_US.UTF-8    LC_MESSAGES=en_US.UTF-8    LC_PAPER=en_US.UTF-8       LC_NAME=C
 [9] LC_ADDRESS=C               LC_TELEPHONE=C             LC_MEASUREMENT=en_US.UTF-8 LC_IDENTIFICATION=C

attached base packages:
[1] stats     graphics  grDevices utils     datasets  methods   base

other attached packages:
[1] ggplot2_2.1.0 shiny_1.0.5

loaded via a namespace (and not attached):
 [1] colorspace_1.2-6 scales_0.3.0     plyr_1.8.3       R6_2.1.1         htmltools_0.3.6  tools_3.3.3      gtable_0.1.2
 [8] yaml_2.1.13      Rcpp_0.12.10     grid_3.3.3       digest_0.6.8     xtable_1.7-4     httpuv_1.3.5     mime_0.4
[15] munsell_0.4.2
Can you guess where the problem is? Thanks very much.
I can't post the second plot with the "regular" image, but when I create it directly from within the same R binary, the axis are labeled with dist and speed and the respective numbers.
I didn't think that this might be of importance, but maybe it is after all: I didn't install R at the "standard" location but I compiled it myself and took my own path as prefix. R is not installed otherwise on the system.
Thanks for this tip. I have already tried resetting the device without a result.
But when I'm plotting to a PDF from within rstudio, it works like a charm. So it probably has to be something with the PNG routines. What does rstudio do differently when it invokes the plot() function as opposed to a regular plot() invocation outside of rstudio?
Hi @jay_analytics and @Panidiomorphic,
Folks are still not sure what's causing the issue, but we've set-up an issue at the following link.
You can follow progress on this issue by commenting, or clicking subscribe under notifications on the github page.
@Panidiomorphic@EconomiCurtis
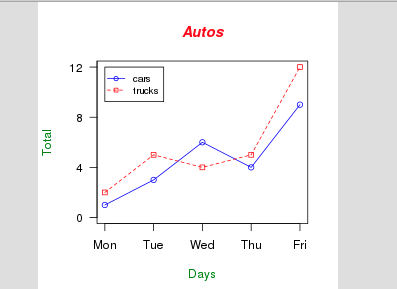
Found what could be the issue. Rhel7 is missing one package "urw-fonts-2.4-16.el7.noarch"
After installing the package I was able to get the English labels.