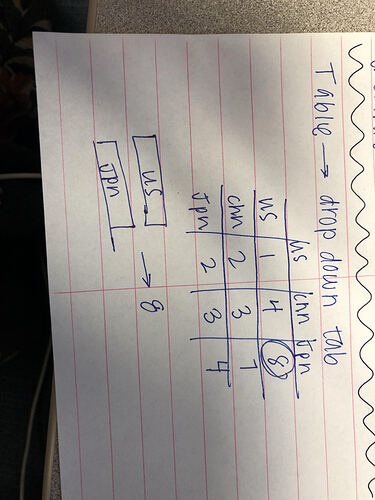
I need to create two drop down tabs (selectInput) with three different countries. Then I want to import data from a table so that when you choose the two countries, the output is the value that was within the table.
Also, since there are two different numbers for US and Japan (8 and 2), will it show both, just one, or will there be an error?
Hi! Welcome to RStudio Community!
Could you ask this with a minimal REPRoducible EXample (reprex)? A reprex makes it much easier for others to understand your issue and figure out how to help, which will help you get the answers you are looking for much faster.
This will include showing what you have tried so far, an example dataset (preferably in the code, and not a picture of hand written data), and what your desired output is.
library("shiny")

read.csv("shiny_test.csv")
country.data <- read.csv("shiny_test.csv")

ui <- fluidPage(
  titlePanel("Invasive species per country")
  sidebarLayout(
    sidebarPanel(
      selectInput("var",
                  label = "Choose first country",
                  choices = c("US", "Japan", "China"),
                  selected = "US"),
      selectInput("var",
                  label = "Choose second country",
                  choices = c("US", "Japan", "China"),
                  selected = "Japan"),
    ),
    mainPanel()
  )
)
This is as far as I have gotten. Only been using rstudio for a week and shiny for a day. Would getting the data from the cvs be in the function(input, output) ?
library(shiny)

# Define UI for data download app ----
ui <- fluidPage(

  # App title ----
  titlePanel("Invasive Species"),

  # Sidebar layout with input and output definitions ----
  sidebarLayout(

    # Sidebar panel for inputs ----
    sidebarPanel(

      # Input: Choose dataset ----
      selectInput("country", "Choose first country:",
                  choices = c("US", "Japan", "China")),
      selectInput("country", "Choose second country:",
                  choices = c("US", "Japan", "China")),

      # Button
      actionButton("update", "Update view")

    ),

    # Main panel for displaying outputs ----
    mainPanel(

      tableOutput("table")

    )

  )
)

# Define server logic to display and download selected file ----
server <- function(input, output) {

  # Reactive value for selected dataset ----
  datasetInput <- reactive({
    switch(input$dataset,
           "US" = US,
           "Japan" = Japan,
           "China" = China)
  })

  # Table of selected dataset ----
  output$table <- renderTable({
    datasetInput()
  })

  # Downloadable csv of selected dataset ----
  output$downloadData <- downloadHandler(
    filename = function() {
      paste(input$dataset, "shiny_test.csv", sep = "")
    },
    content = function(file) {
      write.csv(datasetInput(), file, row.names = FALSE)
    }
  )

}

# Create Shiny app ----
shinyApp(ui, server)
Tried this code, but got lost at "table of selected dataset"
When you're new to both R and Shiny, I think the best way to start is to get your core functionality working in an R script before embarking on Shiny-fication. There's a lot to internalize about how Shiny works, and trying to learn and debug that at the same time as basic R usually leads to unnecessary pain and confusion.
In your case, some more info would make it easier to help:
- Are the data you're importing from CSV already cross-tabulated, or do you need to cross-tabulate within your code? Can you provide some sample data?
- Your goal seems to be selecting a single number from the crosstab. Once it's been selected, what then? Do you want to display that number in explanatory text, or in a table (does a one-cell table even make sense for display?), or something else?
Lesson 5 of this tutorial discusses where in the app structure to put file import code (and more importantly, why to put it there).
It also might help to be aware that the word "table" gets seriously overloaded with meanings in R + Shiny land. Sometimes "table" is shorthand for data frame (or matrix, which is not the same thing as a data frame). Sometimes it means the formatted-for-display version of a data frame (as in renderTable(), and the sample code above). Within base R, table() is one of the main functions you use to cross-tabulate and "table" specifically refers to the output of cross-tabulation, which is not a data frame (it's a matrix with extra attributes).
@jcblum
I have a table with country names as the row titles and column titles
................US..............CHINA.........JAPAN
US.............8..................9...................1.....
CHINA......5....................6..................4.....
JAPAN.......2..................3...................7.....
The drop down tabs would be selecting the two desired countries and selecting the number that corresponds with those two. So, if I chose the US and China then I would want it to give me the outputs 9 or 5. It can be in explanatory text. I have watched many R tutorials and I went through the shiny tutorials as well but I am having no luck. I would appreciate any help you can give thanks!
