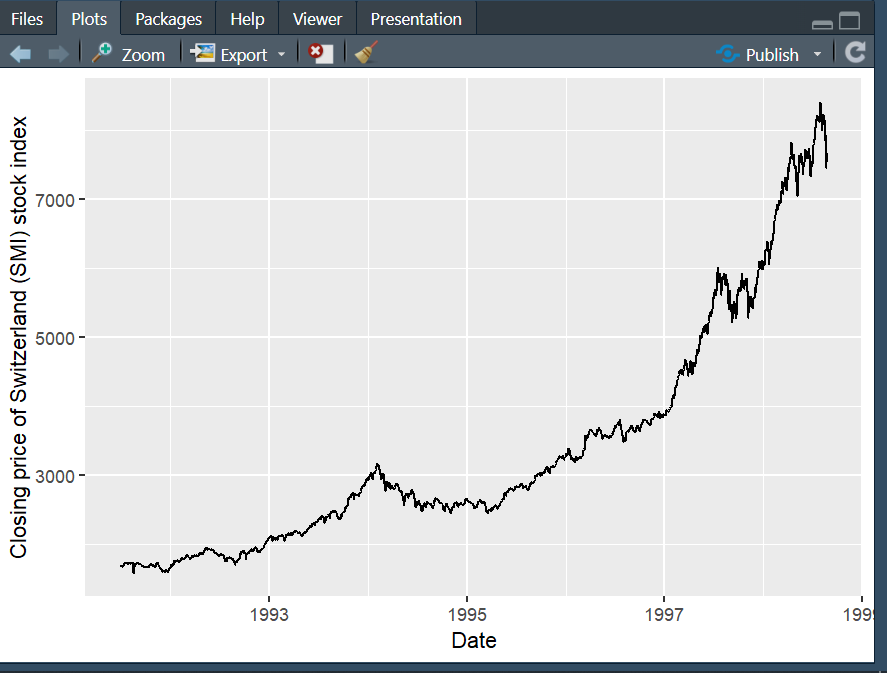
This is screenshot from R Studio:
The result is the same when I download the plot.
As you can see, the right part of the graph is not fully visible. You can't see last year. How can I fix this?
Here is my codes:
EuStockDF <- as.data.frame(EuStockMarkets)
EuStockDF$Date <- as.numeric(time(EuStockMarkets))
ggplot(EuStockDF, aes(x=Date, y=SMI))+
geom_line()+
labs(y="Closing price of Switzerland (SMI) stock index")